A few weeks ago, the NASDAQ-100 sustained a small near-term pull-back of 3.3% from its recent high of $493.70. That pull-back fell right within our forecasted range of 3-4% based on a very reliable trend analysis that goes all the way back to the post-covid correction lows of 2020. Since reaching its $448 lows back on September 4, the NASDAQ-100 (QQQ) has largely followed our outlook on both the short and intermediate-term time-frames.
But as we approach the trading week of October 14, it is absolutely essential that the NASDAQ-100 (QQQ) tests its all-time highs of $503.50 a share for the rally to maintain momentum. Failure to push higher this week would violate two key trends that could allow the bears to take control of the market. In the following sections, we’ll explore those critical trends and wrap up with some thoughts on the underlying risks that could impact our market outlook.
The Intermediate-Term Outlook & Trend
If one were to closely analyze every single market rally going all the way back to 2010, he or she would discover that the NASDAQ-100 (QQQ) rises in only one of two distinct ways. The most common rally type — which we’ll call “High Octane” Rallies — are rallies where the NASDAQ-100 generally rises anywhere from 20-36% over a period of 40-100 trading days (2-5 months). The typical high octane rally produces an average daily return of 0.4%. That is the biggest indicator that the rally is of the high octane variety. We’ve seen nothing but high octane rallies since 2018. That’s nearly 7-years of only high octane rallies where the NASDAQ-100 rallies for 3.5 months on average before sustaining a typical 8-15% correction.
The second, less common type, of rally — often called “Melt-Up” Rallies — are rallies where the NASDAQ-100 generally rises anywhere from 22-29% over a period of 111 to 150 trading days. The typical “melt up” rally produces an average daily return of only 0.19% — half the average daily return of “High Octane” rallies.” In fact, going back to 2010, there have only been seven (7) total melt-up rallies and each one lasted 0.19-0.20%. That’s the biggest indication that the market is in the midst of a melt-up rally. Volatility generally drops to rock bottom levels, trading ranges contract, and the market simply grinds slightly higher each and every day. Melt-up rallies generally lasts twice as long for the same returns as high octane rallies, and thus, generally experience much smaller corrections after ending.
Table 1 below shows every rally going back to 2010. The ones highlighted in blue are melt-up rallies. The yellow highlight areas shows the largest rallies and market corrections:

As you can see from the table above, the QQQ typically experiences rallies of 20-35%, over a span of 40-100 trading days on average, followed by corrections that drop the index by 8-15%. The entire 2023-2025 bull market can be viewed as six distinct rallies with the most recent rally having begun only 25 trading days ago. The last correction spanned roughly 7.7% as the QQQ fell from $485.50 down to $448.16 per share pre-dividend.
Based on the totality of the circumstances — including the long historical trend, the upcoming Presidential Election, earnings season, easing monetary policy and the positive inflationary and economic environment — we expect the NASDAQ-100 (QQQ) to rally roughly 100-points from its $447.50 lows set on September 4, 2024. That would be a relatively modest 22% rally, comparable to the runs we’ve seen during most of the 2022-2025 bull market cycle.
The Near-Term Outlook & Trend
As we’ve mentioned several times now over the last month, these larger intermediate-term rallies often consist of 2-4 distinct smaller segments (“near-term rallies” or “segmented rallies”) each delivering gains of 8-11% over the course of 12-15 trading days (3-weeks). Between these smaller segmented runs, there are minor pull-backs of 2-4% usually lasting 5-7 trading days on average. This pattern has been consistently observed in the QQQ (and to a lesser extent in the SPY) since the market recovery following the COVID-driven correction in 2020.
If you’ve been closely following along these past few weeks, then you already know the NASDAQ-100 only just recently ended one these smaller pull-backs. After peaking at a high of $493.70 a few weeks ago, the NASDAQ-100 (QQQ) sold-off 3.3% to a low of $477.40. This before beginning the current NASDAQ-100 (QQQ) rally, which has returned 3.6% over the last 8 trading days.
Table 2 below outlines every single segmented rally of the 2023-2025 Bull Market run that began in December 2022.

As you can see from the table above, this current rally which sits at a modest 3.58% at 8 trading days is on the low side of the spectrum. Much of that has to do with the push back we’ve seen at the $494 resistance line this past week. Every time the NASDAQ-100 has attempted top punch through that key line of resistance, it has been met with a lot of selling pressure.
I’ll be honest, the NASDAQ-100 (QQQ) is at a critical juncture here and does need to bust through its $494 resistance if momentum is going to continue. In fact, we need to see the NASDAQ-100 (QQQ) bust through its $494 resistance and further climb toward its all-time highs of $503.50 this week.
That’s because by the end of this week we’ll have hit 13 trading days which is nearing the higher end of the duration spectrum. The QQQ should already be gearing up for another 2-4% pull-back. But at 8-trading days, the QQQ has only just barely reached its previous highs.
Based on the historical trend for segmented rallies, the NASDAQ-100 (QQQ) must push through its $494 resistance and further climb toward its all-time highs of $503.50 this week or the bears could take full control over the intermediate-term direction of the market. The short-term trend directly impacts the intermediate-term rally.
It’s very important to note that the QQQ failing to push through its $494 resistance this week triggers a domino effect which could have a significant negative impact on the overall intermediate-term direction. As we noted above in our intermediate-term outlook, we expect this current rally to last around 70-trading days total with the QQQ peaking somewhere near $547-$550 per share. For that to happen, the QQQ needs to swiftly breakout to all-time highs. The sections below will discuss why that’s important.
risks to our outlook
From a chart formation point of view, the NASDAQ-100 (QQQ) will form at least two potentially negative patterns if the QQQ fails to breakout to new all-time highs. To begin with, we have a massive double-top in play. Anytime a stock or market reaches a major high point, sustains a major pull-back or correction and then returns to that high, there’s the risk of a double-top. And that risk increases with each passing day that the stock or index fails to push through to new highs upon approaching those key levels. By default, that possibility is always present and only becomes an issue if the NASDAQ-100 begins to sharply pull-back from its recent $494 highs. If that happens, then we could have a $503.50 top, down to $423.50 neckline, up to a $494 double-top in play. The chart below outlines that possible outcome:
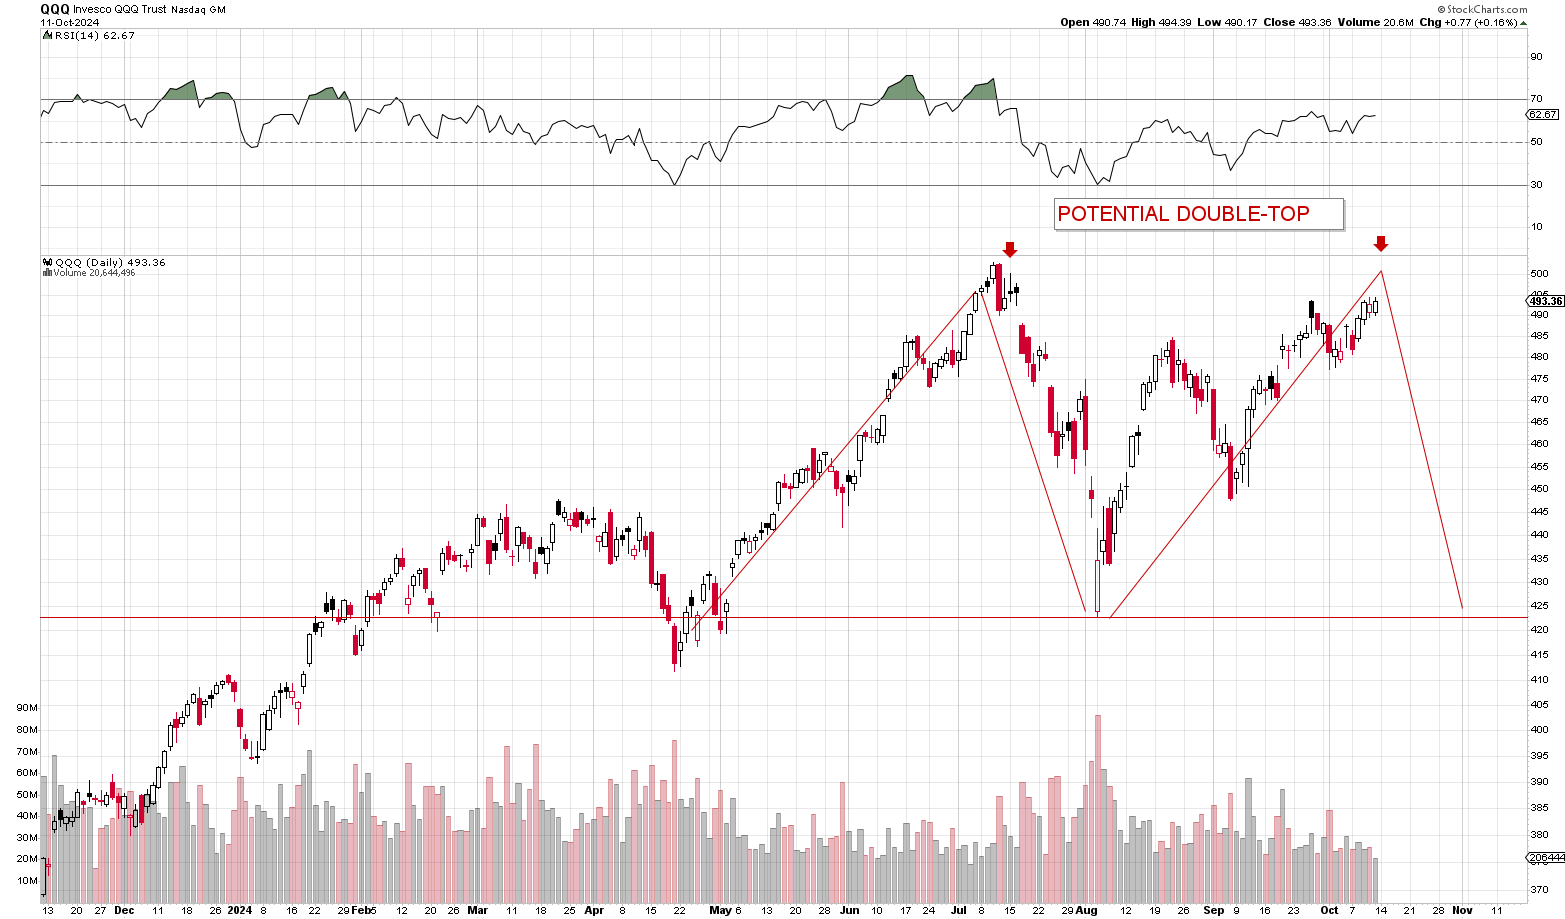
Second, we have a potential 1-2-3 Push Up pattern developing on the NASDAQ-100 (QQQ) hourly chart. Whenever the market doesn’t move straight up or straight down but rather seems to move in a stair-step like fashion, then you have the potential of a three push pattern developing. And that’s exactly what’s happening here.
The NASDAQ-100 had its 1st strong push up from its $423.50 lows to its $485.50 highs. It pulled back to $447.50 and then had a 2nd strong push up to $493.70. That second push to the upside was then followed by a more mild 3.3% 2nd push to the downside. Finally, the QQQ is on its third and potentially final push to the upside on this most recent 3.6% rally. Again, this is just a risk at the moment. What would cleanly invalidate that risk is a searing move to the upside leading to a breakout of the pattern:
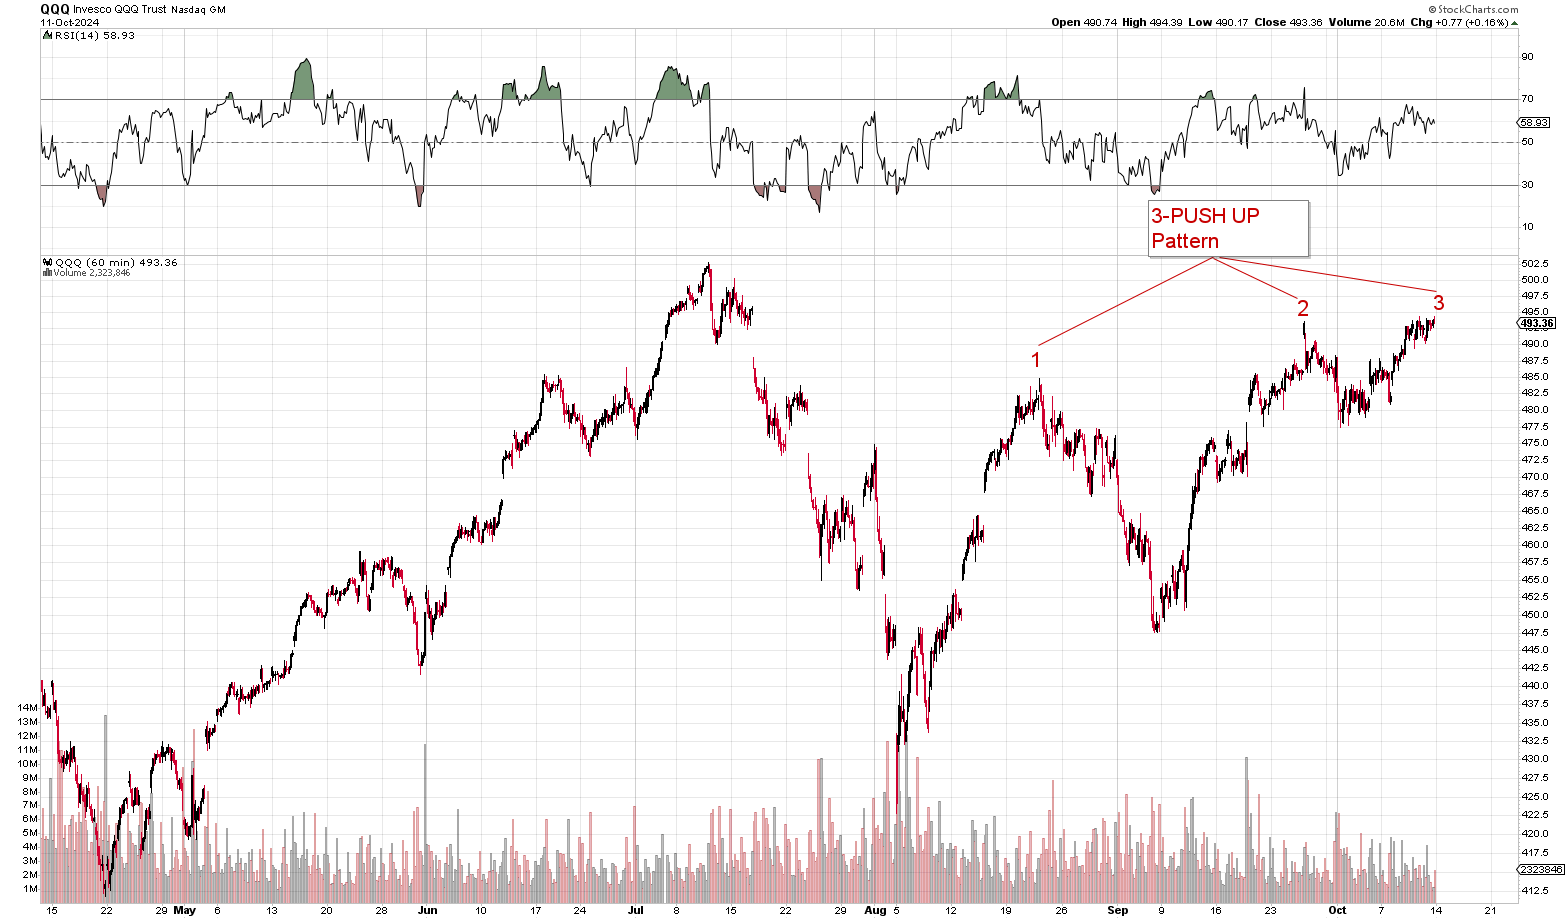
Setting aside double-tops and three push-ups, here’s the real issue and risk to the QQQ rally. Look at the hourly chart above and notice the distinct difference between how this current rally has developed off of the August 5 lows and how the April – July rally developed off of the April 18th lows.
The April – July rally was a nice smooth three legged un to the upside. The QQQ rallied from $413 to $460 (11-12%), pulled back to $443 (3.7%) as it normally would, added a second run of $41 (9.5%) from $443 to $485 before once again pulling back 3% ahead of its final run of 7%. Each segment was explosive and followed by typical 3-4% pull-backs as expected.
But when looking at the current market environment it just isn’t anywhere near as clean or simple. The NASDAQ-100 has largely lagged behind the S&P 500 (SPY) with the SPY reaching fresh all-time highs nearly daily now.
In fact, the S&P 500 (SPY) has done so well that one could easily conclude that the SPY is nearing the end of it up cycle. Unlike the NASDAQ-100 (QQQ) which fell 8% from the end of August to the beginning of September, that period was but a blip on the SPY. The SPY appears as if it has been rallying the entire time since reaching its lows on August 5.
It’s critical to understand the interplay of market outlook & risk. Our market outlook and forecast for the intermediate-term time-frame calls for the NASDAQ-100 (QQQ) to rally to $550 a share. We invested on the outlook and hedge the risk. So while there are risk concerns in both the short and intermediate-term outlook, our strategy is long the NASDAQ-100 (QQQ), long Nvidia (NVDA), long stocks in general and we buy puts and sell covered calls to hedge out the risks like the ones we’ve set forth above.
As all technology stocks are correlated with the NASDAQ-100 (QQQ), these risk also impact the intermediate-term direction of the stocks we’re currently watching. As of right now, we have Nvidia (NVDA), Tesla (TSLA), Google (GOOGL), and Apple (AAPL) on watch for investment in both the Lannister and Tyrell Portfolios.
Nvidia (NVDA) Outlook
With Nvidia (NVDA) having reached a high of nearly $136 last week, it is unlikely that Nvidia (NVDA) sees the $120’s again anytime soon. We’d have to see a full blown correction ensue in the NASDAQ-100 (QQQ) or a poor showing at earnings from either Nvidia or its peers for us to see the sub-$120 space. Furthermore, as we noted several times last week, NVDA is overbought near-term and is likely headed for a near-term pull-back at least. Chances are going to see Nvidia pull-back of between $7-$10 from its highs. Now whether last Friday’s highs of $135.78 are it or whether Nvidia makes new highs first, it is going to pull-back sometime very soon. Nvidia (NVDA) currently on its fourth instance of overbought conditions on the hourly chart. See below:
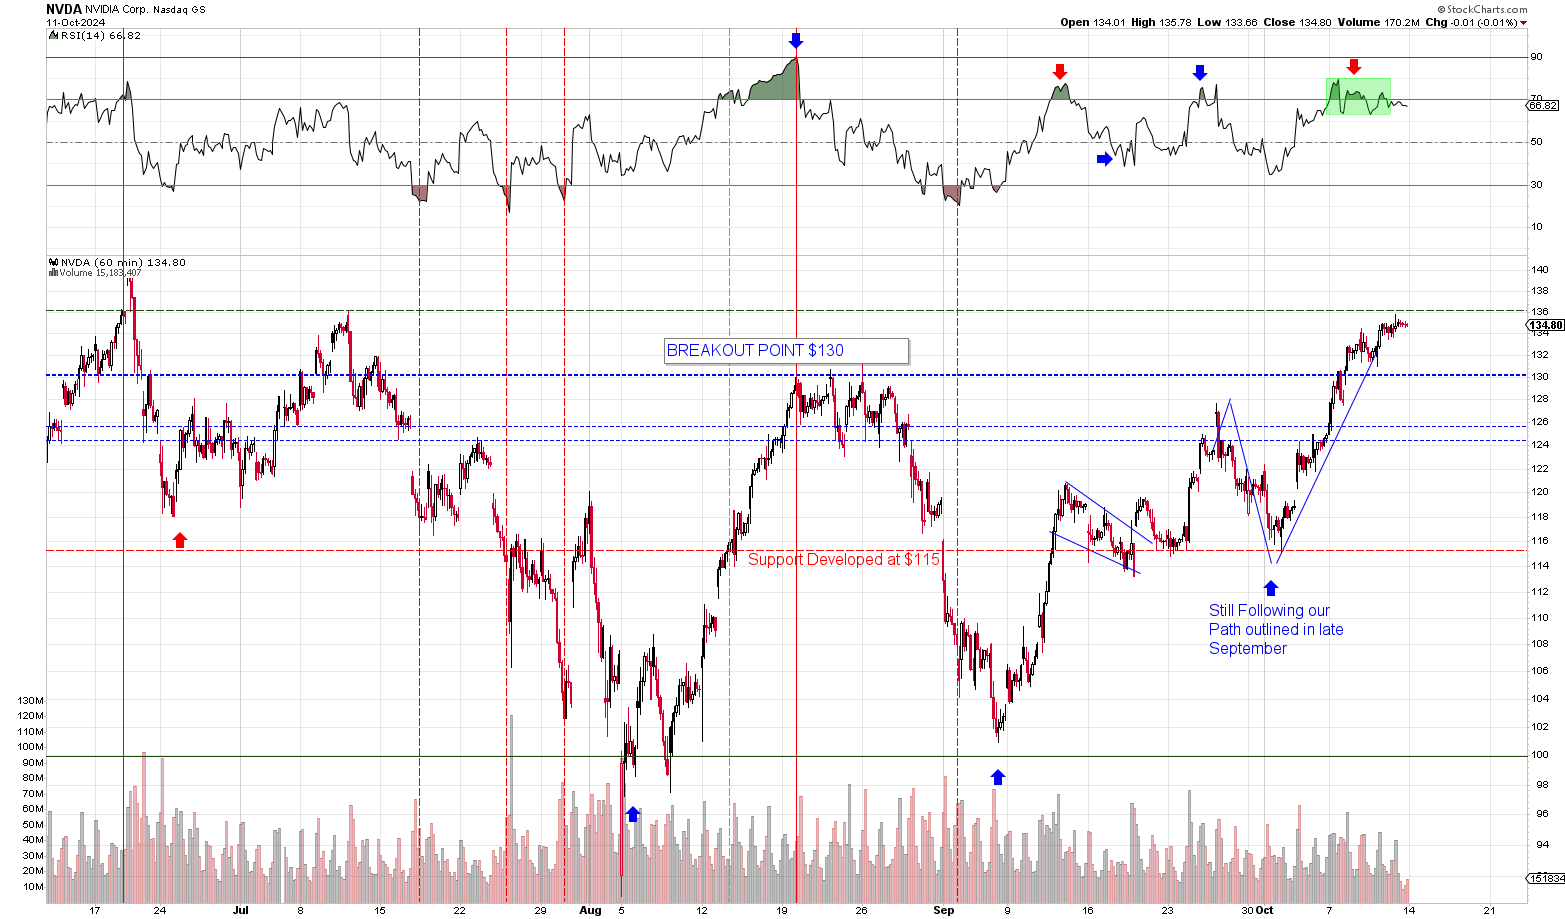
The good news is that after the next pull-back, I think Nvidia (NVDA) will take a crack at its previous all-time highs of $141. In fact, it wouldn’t surprise to see Nvidia (NVDA) trade near those $141 highs as it heads into earnings with earnings being the determinative factor in is breakout run to new levels ($150-$160). It could easily push through $141, run up to new highs in the $140’s and then pull-back going into earrings. Or it may simply breakout, run and earnings could just add fuel to the fire.
Regardless of the “how,” what’s crystal clear right now is that Nvidia (NVDA) is indeed set-up to breakout. With the stock trading a full $5.00 above its previous resistance of $130 a share, fresh all-time highs is almost a foregone conclusion at this point.
Tesla (TSLA) nearing a buying opportunity
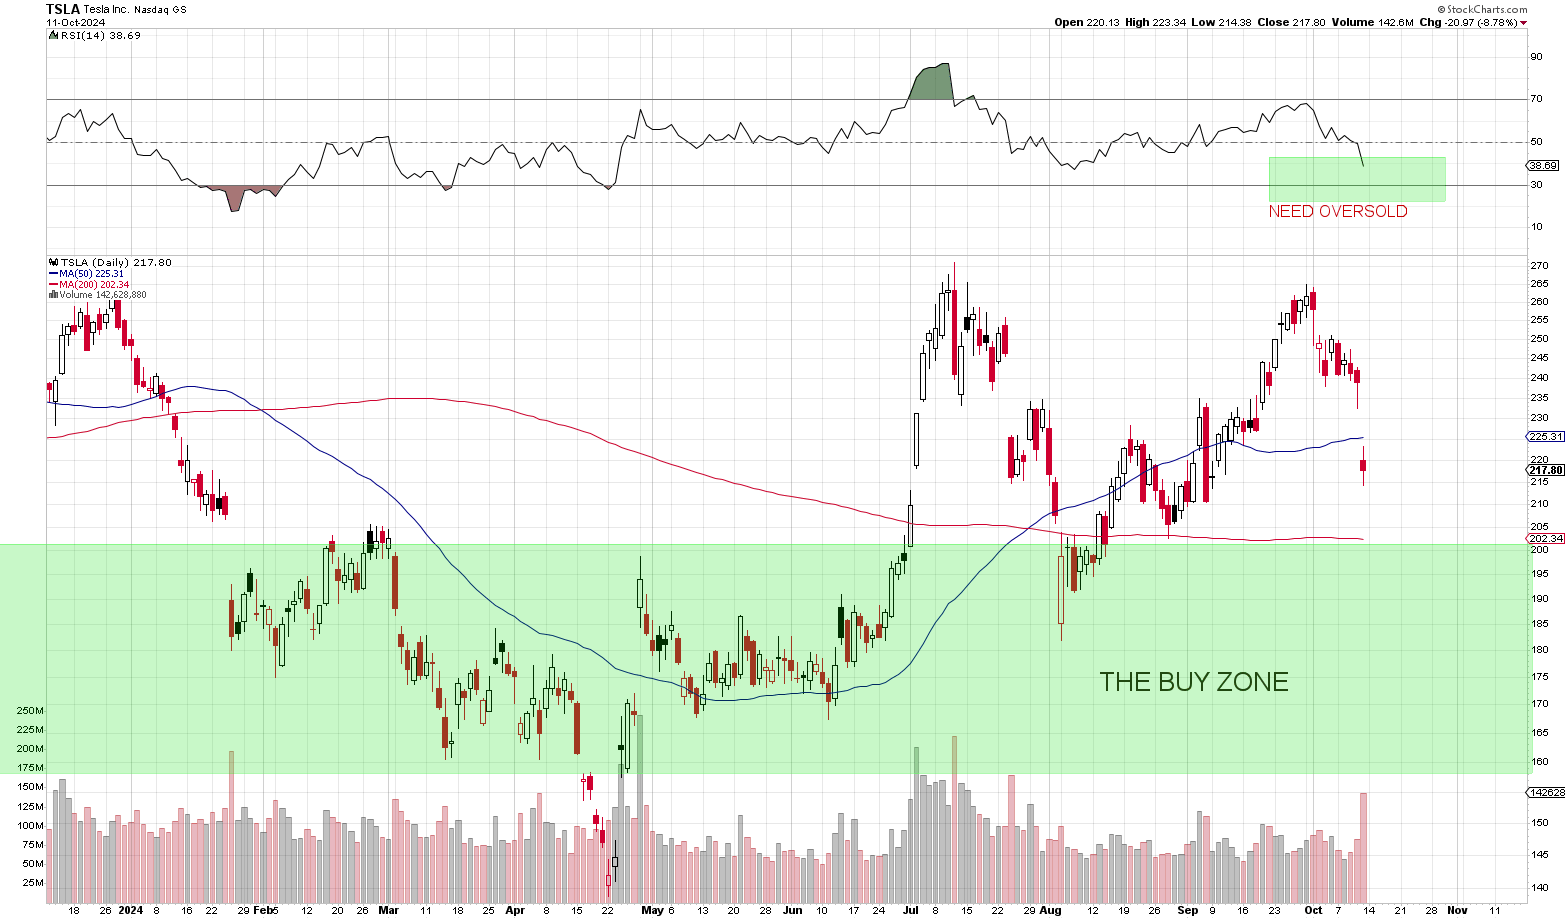
With Tesla (TSLA) selling-off after its “We Robot” event — which I thought went well given the potential of the Robotaxi & Robovan. But setting the fundamentals aside — which are very strong in Tesla — the stock does trade in a distinct overbought/oversold cycle. Whenever Tesla pushes down into oversold territory on the daily or down toward a prior trading range, it typically rallies hard in the other direction. There’s probably a very solid investment/trade to be hade down near the $185 area. If the stock continues to take a beating after Friday’s shellacking, then we’ll probably look to buy some Tesla for both the Tyrell and Lannister portfolios.
Alphabet (GOOGL) on trade watch
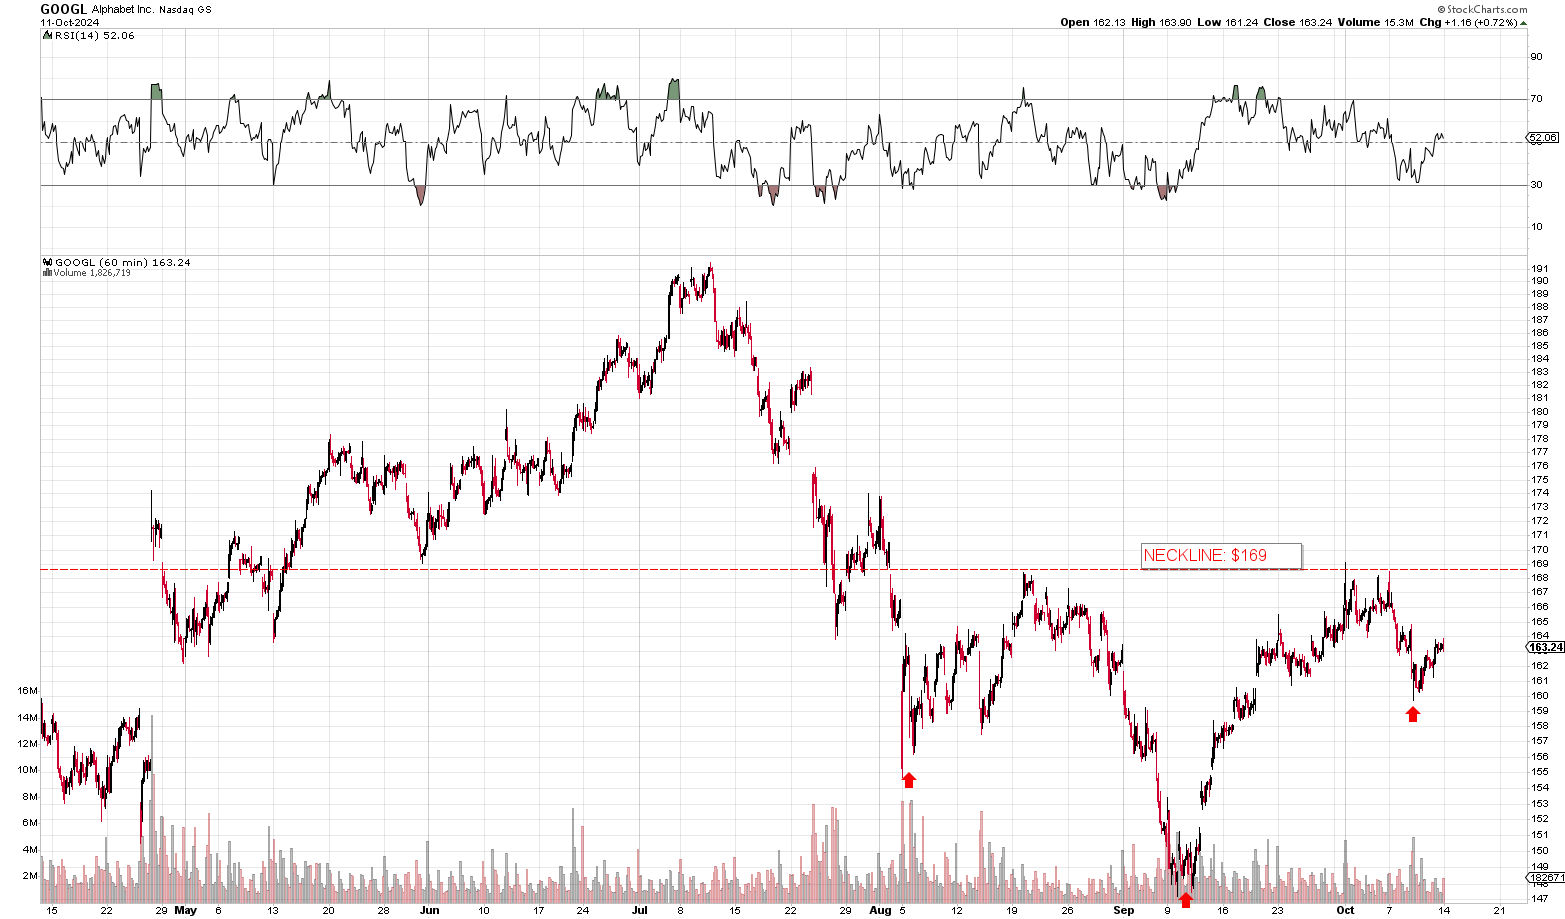
Google is also on trade watch. As we mentioned during the trading week, we’d like to see Google trade down to the $155 area before we could confidentially get long the stock. Even at $158 we’d probably add some shares/contracts to the portfolio given the inverse head & shoulders forming on Google and given the upside potential. Google is likely to return to its all-time highs in the next 3-9 months and that’s a full 23% above current trading levels.
Hedging the Lannister Portfolio
Last week we hedged out the Tyrell Portfolio and now we could just sit back and watch it grow. If the entire stock market crashes 50%, we end up either making money or barely down much. If it goes up 50%, we make even more money. I cannot over-stress the importance of hedging.
And to that end we will soon be hedging the Lannister Portfolio as we’re now up 25% on the month. That’s a lot of gains for a single month of trading. We’re going to use some of our capital on the sidelines to hedge out our risk and protect the Lannister portfolio as we did the Tyrell Portfolio. We’ll probably use a very similar strategy and some of the same exact put options.

Thanks for the read, I was hoping to read something about the QQQ lagging and there you go.
Considering a NVDA near term overbought pullback, that will add extra pressure for the QQQ to break 494 – 503 range.
Everytime I open up the charts, I see this massive bull run we had going. Also considering the S&P 500 P/E ratio, fear is growing (at least for me) we are up for a big correction, like the potential double top (and then the following downside after breaking the 423 neckline). Im currently diving into hedging. My broker unfortunately doesnt allow selling covered calls.
So as a reminder, we just recently had a correction in the S&P 500 in mid-July to August. The S&P 500, like the NASDAQ-100, has been rallying on a 70-day average. 3.5 months on average of upside between corrections. Right now, we’re currently at 2.5 months. So I think we could see another 4-weeks of upside.
The NASDAQ-100 is only at 25 trading days when considering the September correction. So we could see a lot of upside before we arriving at another intermediate-term top.
Market has opened in a marked contrast to the tone of the article when it was posted. Can we get some updated thoughts?
So on each trading day we publish a post called “Daily Briefing.” That post is updated throughout the trading day. Kind of like a live blog.
With regards to tone, that gives me an idea. So the tone wasn’t intended to suggest the market was headed lower by any stretch of the imagination. That’s not the tone we wanted to set. The tone we wanted to set was the NASDAQ-100 is at a critical juncture and needs to perform this week by breaking above $494 or else the risks of a correction increase markedly. That’s the tone we wanted to set. I think in the future, we’ll probably try to include something on tone with the highlighted containers. The blue containers were meant to summarize or highlight our outlook & risks.
It’s important to remember that we’re overwhelmingly long the QQQ and Nvidia in all of our portfolios. We’re also hedged in one portfolio at the moment with the expectation of putting on further hedges this week. Our outlook is for the NASDAQ-100 to run to $550 before sustaining another correction.
However, we do have to outline risks where we see them. The biggest risk we had this week is the domino effect that would kick off if the NASDAQ-100 didn’t breakout this week. Without a breakout, you end up with an off-trend situation, the double-top possibility, 3-push up and all that nonsense. But those risks don’t really constitute our outlook. As outline in the blue containers, our intermediate term outlook is:
“Based on the totality of the circumstances — including the long historical trend, the upcoming Presidential Election, earnings season, easing monetary policy and the positive inflationary and economic environment — we expect the NASDAQ-100 (QQQ) to rally roughly 100-points from its $447.50 lows set on September 4, 2024. That would be a relatively modest 22% rally, comparable to the runs we’ve seen during most of the 2022-2025 bull market cycle.”
The risks to the outlook are laid out in the subsequent blue container in the bottom half of the post:
“It’s critical to understand the interplay of market outlook & risk. Our market outlook and forecast for the intermediate-term time-frame calls for the NASDAQ-100 (QQQ) to rally to $550 a share. We invested based on the outlook and hedge based on the risks. So while there are risk concerns in both the short and intermediate-term outlook, our strategy is long the NASDAQ-100 (QQQ), long Nvidia (NVDA), long stocks in general and we buy puts and sell covered calls to hedge out the risks like the ones we’ve set forth above.”
But the NASDAQ-100 didn’t disappoint and we’re one step closer to a full breakout with today’s push up to $498 earlier this AM. The level we really want to see taken out or test this week is the all-time high of $503.50. Once we get the QQQ through that point, then we finally move up to our short-term target of $515-$525. That’s where we’d like to see the NASDAQ-100 see its next near-term peak and 3-4% pull-back. Anything short of that and we get all sorts of bearish scenarios setting up.
Do you still see a $7-$10 pullback in the cards for NVDA?
Yeah that is largely unavoidable. Nvidia has pushed into overbought territory and has now traded overbought for about a week. Going back 8-10 months, there hasn’t been an exception to that rule.
The way to view overbought territory is as a countdown. Once Nvidia reaches overbought, it just tells you that a pull-back will happen within a set number of trading days. If we went back and looked at averages, it’s probably 3-10 days of reaching overbought.
But for our purposes, it really doesn’t mean all that much because we’re already fully long Nvidia and hedged. So it’s just mostly for charting its course.
Our expectation now is pull-back to the low $130’s — depending on where it ultimately peaks — followed by another surge up to all-time highs.
Hi Sam, wondering if you think SP500 is headed for a major correction? If so how much would you expect it to fall from its all time high? It really looks like it has been on a nonstop rally—how much more can it go?
Cheers
We just had a correction in August. The markets aren’t due for a while. As you can see from the two tables I posted on the QQQ, we generally need to see 40 trading days minimum before seeing another correction. The average is 70-days. We’re not really near that point just yet. The SPY just breakout to another high today.
Obviously, we outlined some risks of a double-top and things like that potentially playing out on the NASDAQ above. But I think overall, the risk is to the upside.
It may be a while before we see any sort of a top in the S&P 500. To give you some examples, the last rally went from April to July. The rally before that went from November 2023 to April 2024. That’s like 5.5 months and 4 months. That’s right inline with 70-100 trading days. There’s about 22-23 trading days a month.
Those tables I posted in the weekly roundup are really important. It’s important to understand them as they outline a very consistent cycle that has taken place going all the way back to 2010.
thanks! makes sense
is NVIDIA’s pullback in line with your expectations or has it been a little too aggressive? Do you expect a further pullback with NVDA if the QQQ cannot sustain its momentum to go past 494?