The TL;DR & CliffsNotes Version
I realize some people might have better things to do than to read some long-winded wall of text on the short and intermediate-term direction of the market. While we update our Current Outlook, we’ve included these blue posts to highlight our actual outlook. Feel free to skim the text and note the outlook. Everything else in here comprises of evidence in support of that outlook and/or hedging statements and risks to our outlook.
With the market absolutely skyrocketing in the days following the Presidential Election on Tuesday, November 5, the NASDAQ-100 (QQQ) busted through a major line of resistance at $500 a share. Virtually everything moved higher with several stocks making fresh all-time highs. The entire market looked set to move significantly higher after having consolidating for the entire month of October.
In fact, the S&P 500 and Dow Jones Industrials both had their best week of the year, rising nearly 5% to end the week at fresh all-time highs. Normally when we get an explosive rally like that, there’s almost always follow through. These things are not typically isolated events. Especially when the indices are making fresh all-time highs as they did all week. And especially after breaking through a major line of resistance as the NASDAQ-100 had.
For the market to follow their best week of the year with FIVE (5) consecutive down days last week, including a huge 2% beating on Friday, it raises some big questions about whether we might be seeing the start of a significant correction right now.
But before jumping into the intermediate-term outlook, and the general correction risks involved, we’ll first examine what the near-term action is telling us and why the market is most likely to rally next week. Especially seeing as how we’re heading into Nvidia’s earnings on Wednesday.
Near-term Outlook
NASDAQ-100 (QQQ) Likely Rallying $10-$12 from its lows early next week
If there’s one time frame we’re confident in predicting, it’s the near term. Whether the market has or hasn’t entered a new intermediate-term correction is unclear. But what we can say with a relatively high degree of confidence is that the market is likely to rebound big-time next week.
As we noted throughout the trading day on Friday, the NASDAQ-100 has reached extremely oversold territory on the hourly which is THE MOST reliable indicator there is for forecasting a near-term rally. As you can see from this 6-month chart below, anytime the QQQ has reached extremely oversold territory on the hourly (23-RSI or lower), a big rebound of at least 2% generally follows shortly thereafter:
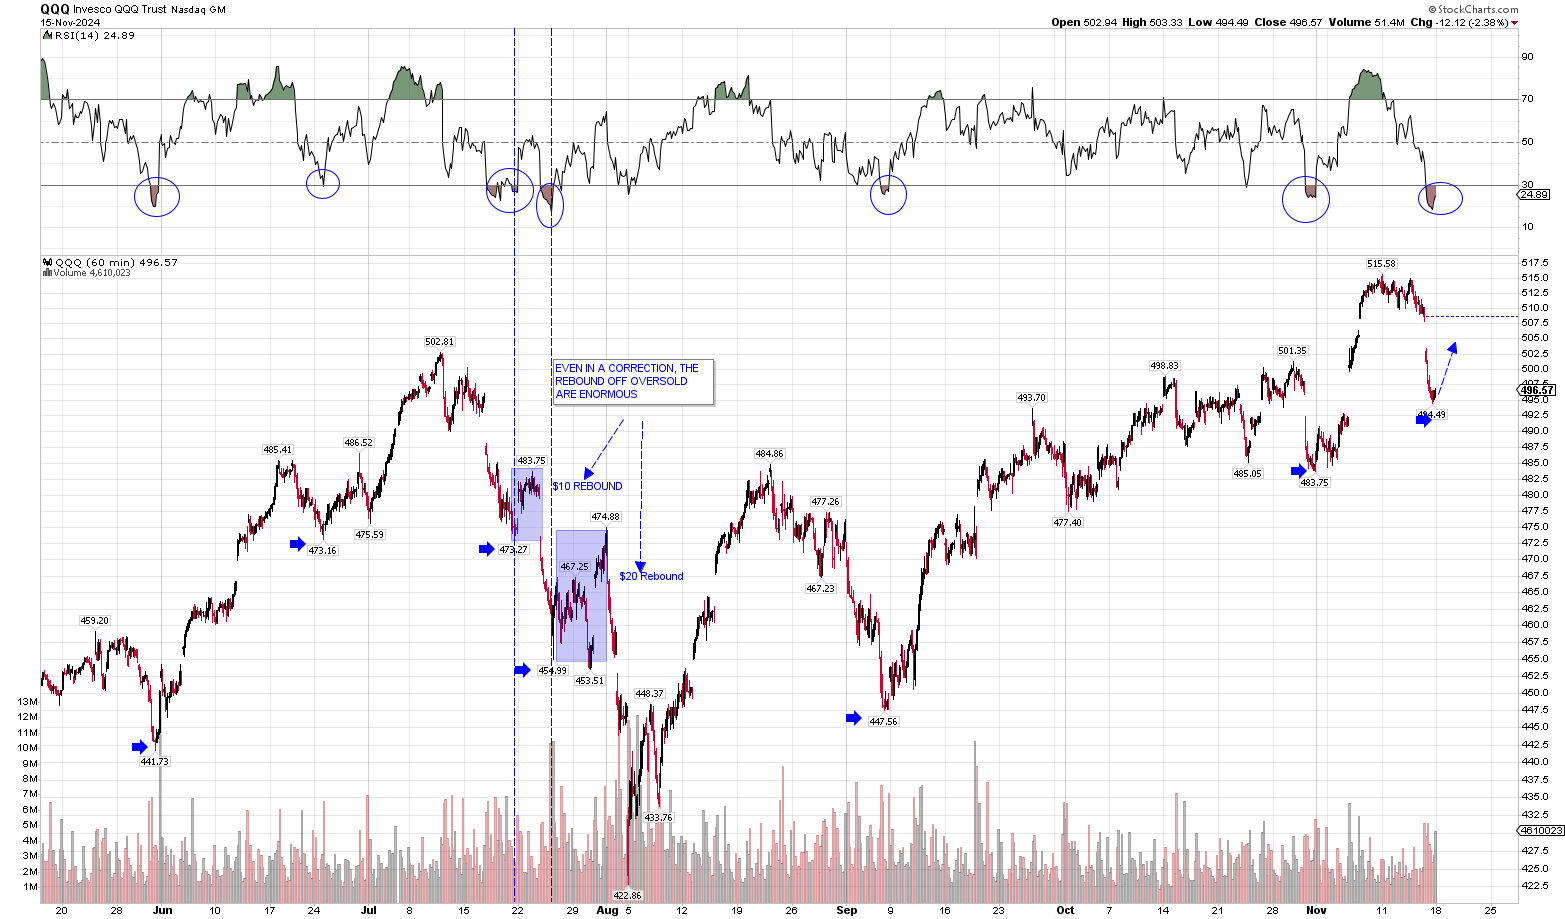
Note the arrows in the chart above. In the last 6-months, there are NO EXCEPTIONS. The QQQ has rebounded a minimum of $10.00 (2%) and usually a lot more than that. Going back to May, the QQQ has sustained 9 instances of reaching oversold conditions on the hourly, and in all 9 instances we saw immediate rebounds of 2%+. Chances are the NASDAQ-100 (QQQ) will see the same here.
Just to illustrate this point further, here’s this same exact chart extending further back another 6-months. The chart above shows the NASDAQ-100 (QQQ) over the past six months from mid-May to mid-November 2024. This chart below, shows the QQQ reaching oversold territory on the hourly from December 1, 2023 to June 1, 2024:
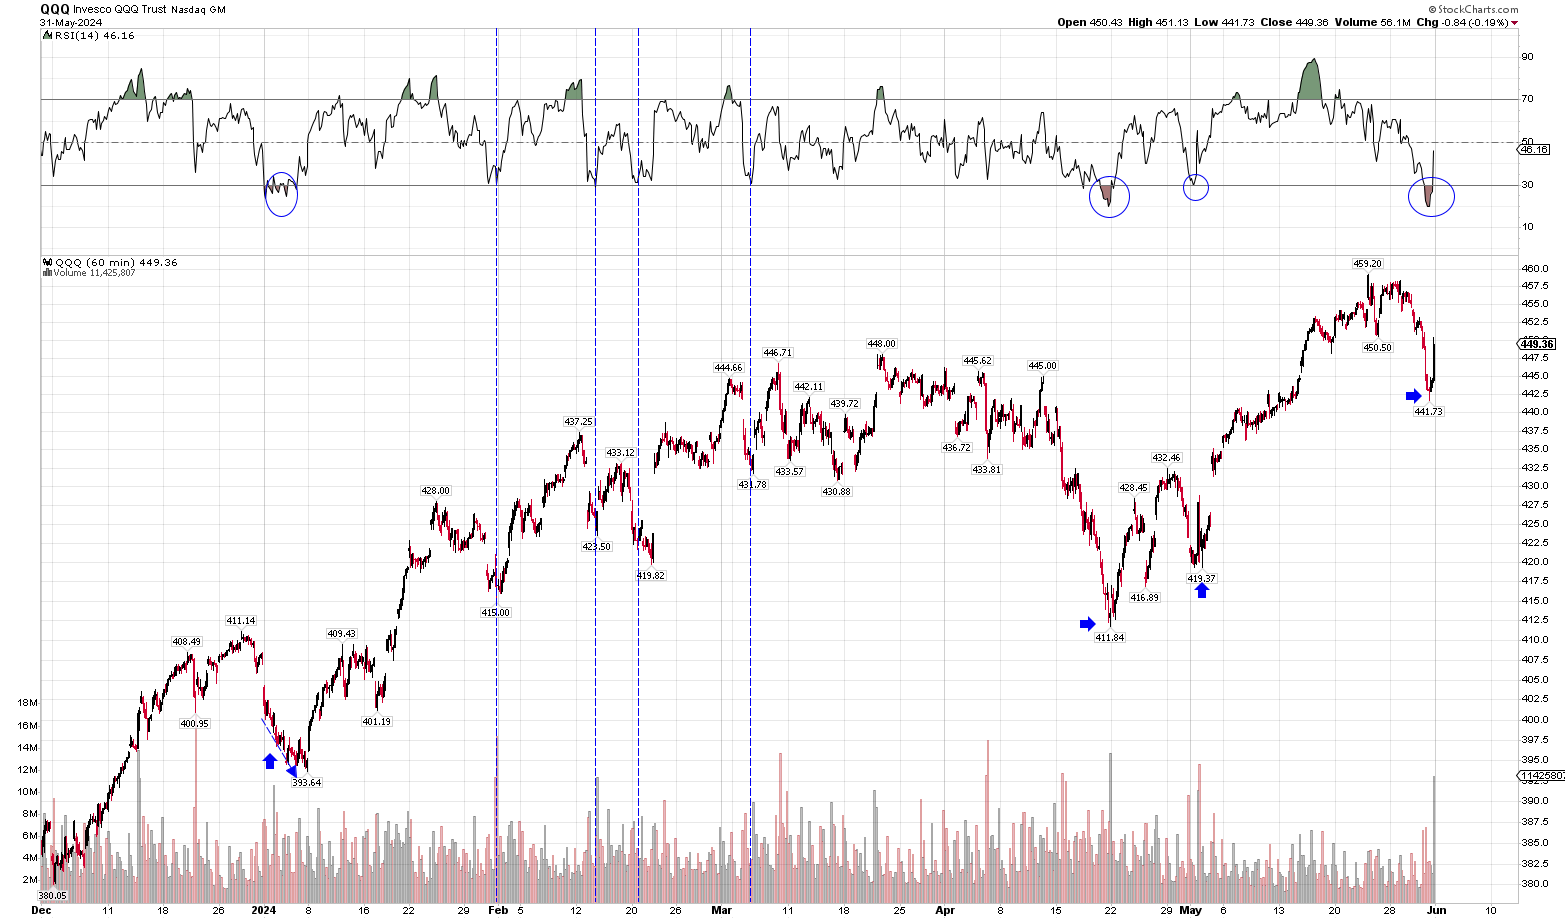
As you can see from the chart above, there was only ONE instances where the QQQ didn’t immediately rebound upon reaching extremely oversold territory. That was in January 2024 where the QQQ first reached extremely oversold at $400, dropped to a low of $393.64 (-$6.36) before ultimately rebounding straight up to $410 anyway. Still, in the overwhelming majority of the cases, when the NASDAQ-100 reaches a sub-20 RSI on the hourly for an extended period of time as it has on Friday, that generally leads to a big rebound.
We expect the QQQ to ultimately rebound at least $10.00 from its low point. At the moment, the low print on Friday was $494.49. A 2% rebound takes the QQQ up to around $504-$505 a share. Most rebounds go further than that, but that is the expectation for the time being.
This upcoming rebound will impact the entire tech sector at large as all stocks are highly directionally correlated with the indices. If the indices move higher, so do the individual members of that index in most. cases.
Whether the QQQ ends up sustaining a second leg lower after that rebound is an intermediate-term outlook question which we’ll discuss below.
Nvidia (NVDA) likely rebounding to $145+ before earnings
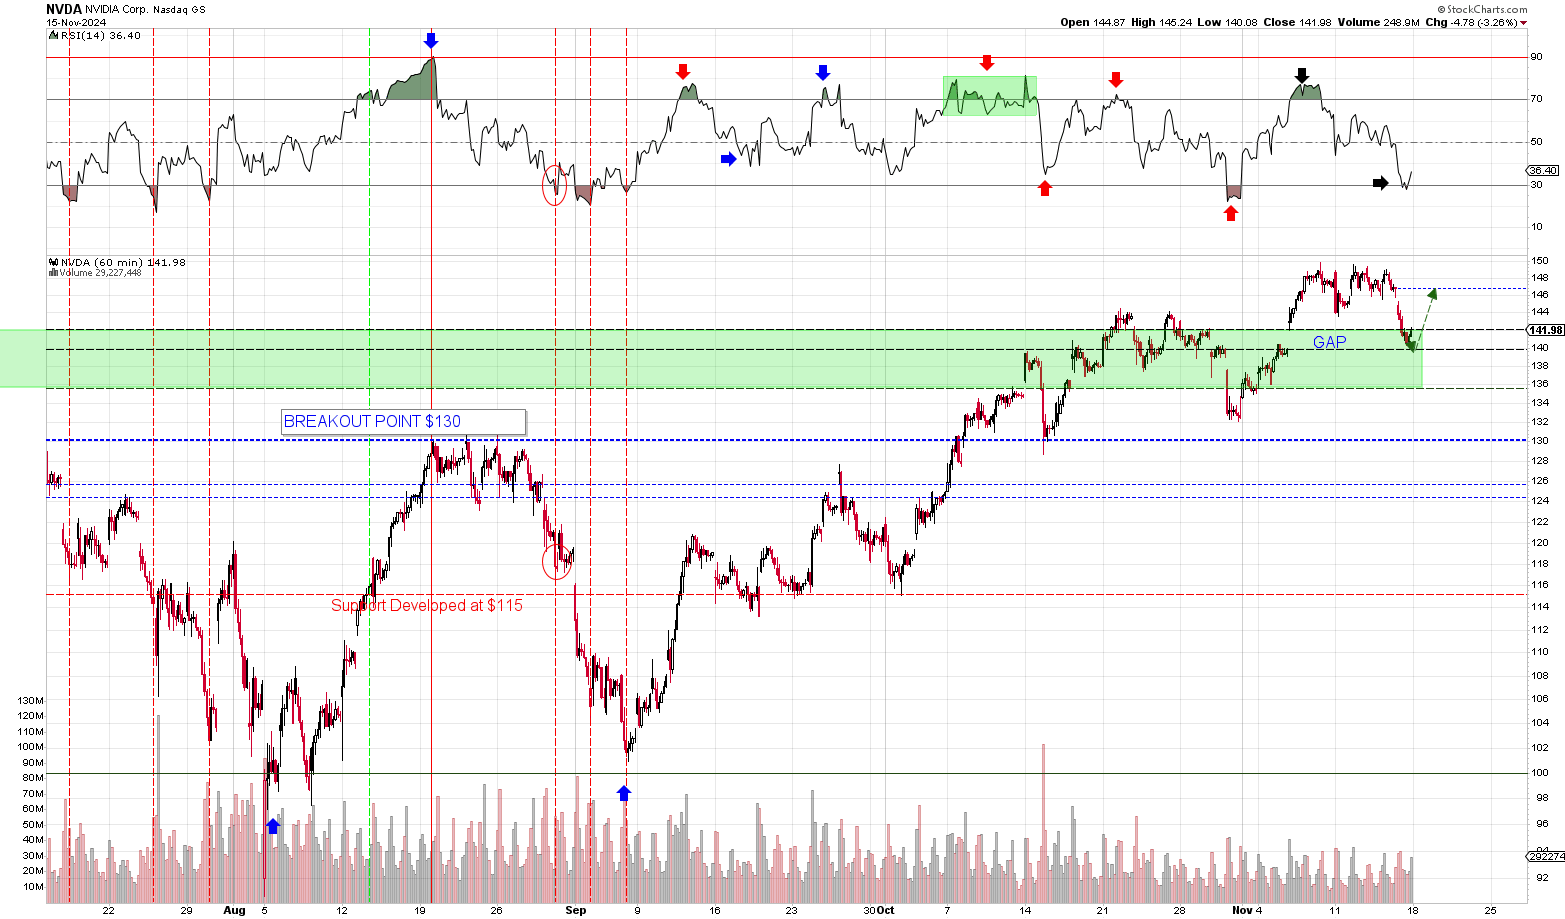
Like the NASDAQ-100 (QQQ), Nvidia also reached oversold conditions and held its support at $140 a share on Friday. There are a few key difference with Nvidia as technicals are concerned, however. First, Nvidia has a tendency to initially trend lower after reaching extremes. It will eventually rebound and in most cases, buying Nvidia when it reaches oversold is generally a good strategy. But we have seen some past instances where Nvidia has trended lower for sevearl day after first reaching oversold territory. Every stock, index and asset has its own trading pattern. Just because the NASDAQ-100 (QQQ) consistently rebounds off oversold territory, doesn’t mean that all stocks follow the same general trend.
That being said, with both the NASDAQ-100 and S&P 500 set to likely rebound early next week, the general broad market direction is likely to put upside pressure on Nvidia (NVDA). The S&P 500 (SPY) is just as oversold as is the NASDAQ-100 and has an even stronger trend than the QQQ of rebounding more consistently off of oversold territory.
Furthermore, with Nvidia set to report earnings on Wednesday coupled with the fact that Nvidia strongly held its support at $140 highly suggests that we should see a rebound up to around $145-$147 in Nvidia going into the report. And we will use that opportunity to sell covered calls against our Nvidia long positions which we will discuss in our investment strategy.
The chart below shows the Nvidia (NVDA) hourly chart and our expectation for a Nvidia rebound up to $146 ahead of earnings. Notice how Nvidia tends to trade upon reaching oversold territory:
NASDAQ-100 (QQQ) Intermediate-Term Outlook
While the near-term indicators are all pointing toward a strong rebound happening early this week, the intermediate-term outlook has become a little more uncertain given everything transpired this past week. There is some evidence indicating that the QQQ could experience a correction much sooner than expected, but overall we still believe the QQQ still has another leg higher before we see an intermediate-term peak at around $530-$535. That is our intermediate-term outlook. We’ll cover each issue and risk impacting the outlook below:
ISSUE #1: Segmented Rally Analysis
Heading into last week’, our intermediate-term outlook was for the NASDAQ-100 (QQQ) to (1) first push up to around the $525-$530 level near-term; (2) followed by a 3-4% pull-back down to $500 (3) leading into a final leg up taking the QQQ up to $550. From $550, our expectation was for the NASDAQ-100 to sustain a 10-12% correction sometime in January. That was our original outlook going into last week and for some very specific reasons.
There were three big reasons supporting our forecast for the QQQ peaking at $525-$530 a share near-term. Those were:
(1) the unusually strong momentum seen in the post-election rally. Strong momentum marked by deeply overbought RSI on the hourly generally leads to further upside in the overwhelming majority of the historical cases. Strong momentum seldom happens isolation as we just saw when the market hasn’t underwent any sort of negative divergence. Go back and look and you’ll find very few cases where that has happened in this recent bull market run that began in 2022.
(2) the segmented rally analysis, which we’ve posted repeatedly here at Sam Weiss, clearly shows that the QQQ tends to rally in 8-10% segments ahead of 3-4% pull-backs. If you go back and look at every major intermediate-term rally since the lows in 2022, you’ll find that the NASDAQ-100 (QQQ) tends to enter into these broad intermediate-term rallies lasting anywhere from 3-5 months (70-100 trading days). During those rallies, the QQQ might return anywhere from 22-30%.
What’s more, those rallies don’t just happen as one single leg. Instead, these larger intermediate-term rallies generally unfold over anywhere from 2-4 segments with each segment returning 8-10% over 3-weeks on average. The pullback between each segment tends to go for 3-4%. That has been the general pattern and trend for the QQQ. This table below shows each segmented rally going back to December 2022:

So why did we expect the QQQ to rise to $525 before peaking? Because the most recent segment which began at $483.42 would normally run up to $522.10 (8%) to $531.76 (10.0%). That’s the typical range of 8-10%. What’s more, add to that the strong post election momentum and the fact that (3) the QQQ had spent three weeks consolidating ahead of its major breakout above $500, the $525-$530 was the most likely range for a 3-4% pull-back.
Instead, what we got was a peak at $515.58 which is about $10.00 or 2% short of our target. There are two BIG takeaways from this analysis as the intermediate-term is concerned.
(1) The first takeaway is that this current pull-back we’re seeing could very very easily be nothing more than one of the 21 other 3-4% pull-backs we’ve seen going back to December 2022. With the QQQ having peaked at $515.58 and dropping to a low of $494.50 last week, that constitutes a 4.08% pull-back from peak to trough. There is a big possibility that this 4% is just a regular 3-4% pull-back we see after every other 8-10% move up in the market. While the QQQ may have peaked 2% lower than the average, this is not without precedent. Look at the table above and you’ll find five previous cases of the QQQ peaking at the 6-7% mark as we’ve seen here.
(2) The second takeaway is that if this ultimately is just a small 3-4% pull-back inline with the historical trend, then the overall rally which began in September is probably nearing its end. We only really 2-3 of these segments in each intermediate-term rally and this would mark the second such segment. With it being on the smaller side of the spectrum and given the overall long consolidation we had in October, chances are the market has one more leg up ahead of a correction. If we have a bottom at $494, then it puts us at a peak near $535-$545.
ISSUE #2: Intermediate-term Rally Cycle
Related to the Segment Rally analysis is the intermediate-term rally cycle. We mentioned this a little above. Since the beginning of this bull market rally in 2022, the NASDAQ-100 (QQQ) has sustained five-six separate intermediate-term rallies from its lows of $250 to its highs of $516 last week. We’re on either the 5th or 6th rally depending on how one considers the issue. There are arguments to be made that this current rally began on August 5 when the QQQ reached $423.50 a share and is now its last innings ahead of another correction. There are other arguments that suggest this rally began at $447.40 on September 4 and still has a ways to go. And the uncertain involves timing. The QQQ had massive 14% rally off of its $423.50 lows which is more than enough to constitute a 10% rally. The problem is the rally unfolded in just 14-days which is on the extreme low end of the time spectrum.
If this rally began in August, then the QQQ is now up 22% and that is very much a developed rally and due for a correction. If this rally began in September, then the QQQ is really only 15% higher and a correction would be a bit premature. Again, this is from a cycle point of view. Take a look at the chart below. It shows each rally (and correction)going back to the lows of 2022:
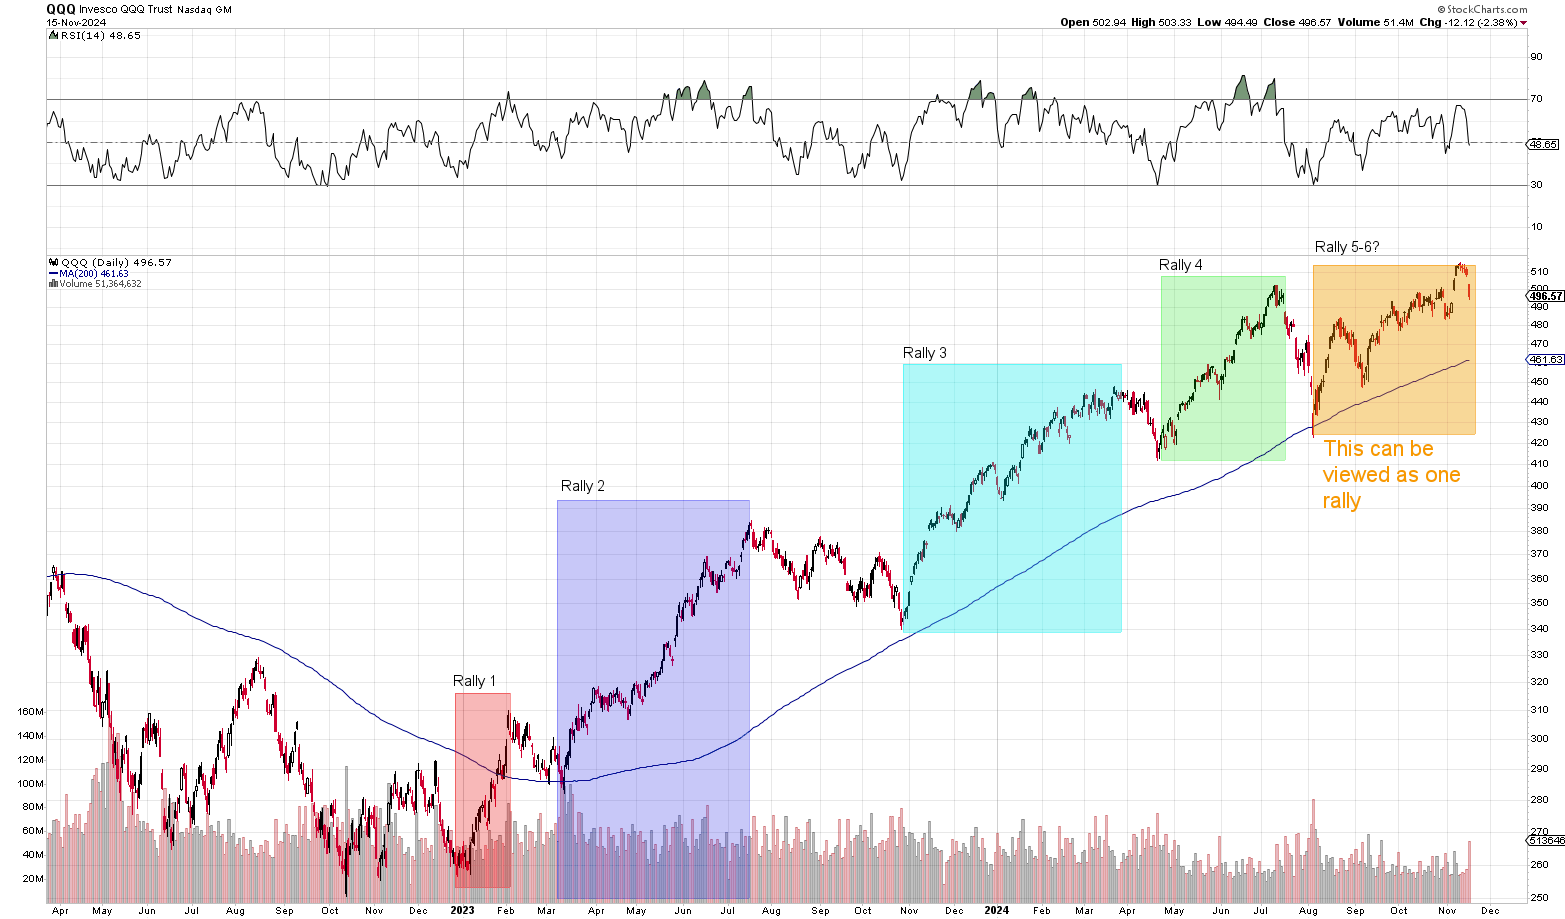
This table below shows these five-six recent rallies (bottom of the table) and includes every single intermediate-term rally going back to 2010. From a table/data perspective this really began in September since we had a true 7.7% correction during that period. But from a chart perspective, this current rally appears to have began on August 5 and we may very well be nearing the end of the run now. I think ultimately we’re at most 1-leg up from another 10% correction that will likely begin at around the $530-$535 area.

ISSUE #3: The $500 Level on the NASDAQ-100 (QQQ) is Turing into an Index-Defining Resistance Line
A huge concern/risk we need to talk about is how the $500 level on the QQQ is really becoming a major area of contention. With the QQQ falling back under $500 last week, there is some genuine concern that the QQQ might not convincingly retake that level even if it temporarily rises back above $500 in the near-term.
The first time the NASDAQ-100 tested the $500 level was back in early July. The QQQ had rallied more than 22% correction low of $412 in April all the way to its $503.50 high on July 10.
The QQQ spent almost no time at all trading above $500. In fact, the very day after first breaking above $500, the stock opened flat only to promptly reverse course and crash a full 2.7% down to $490 a share. That massive reversal lead right into what was the QQQ’s largest correction of the bull market era. The QQQ would spend the next three and a half weeks falling $80.00 (16%) from its high of $503.50 set on July 11 down to a low of $422.85 on August 5. Nvidia (NVDA) dropped 30% from its all-time high of $140 down to $90 per share during that period. It was a brutal sell-off by all accounts.
But after bottoming on August 5, the NASDAQ-100 (QQQ) eventually recovered all the way back up to $500 and would spend the next two month making several attempts and failures to break above the $500 level.
In fact, in the three weeks leading into the Presidential Election, the QQQ spent all of its time trading either near the $500 or just slightly above $500 a share. Failing to breakout above that key line of resistance on each attempt.
Remember, this is after the QQQ originally peaked at $503.50 back in July, crashing down to $423.50 in August and then returning back to the $500 level between September and October.
It wasn’t until the market responded very favorably to the federal election, that the QQQ had finally taken out its $500 resistance and surged to a high of $516 a share. The problem is the QQQ couldn’t hold above that key support level as it fully unraveled on Friday.
It’s important to understand that when something like this happens after the NASDAQ-100 goes that far beyond the $500 resistance level, it raises some major red flags as to the intermediate-term direction. There is a genuine concern that the QQQ might not be able to fully retake the $500 level before undergoing another serious correction and retest.
It is highly concerning that just one week after the breakout, the QQQ pushed all the way back down under its key support/resistance line of $500. When looking at the weekly chart, it gives off the impression of a potential double-top in play. If it weren’t for the fact that the overall fundamentals of the economy don’t support the conclusion, the risk here is that the QQQ has formed a sort of massive bull-market defining resistance at $500. See below:
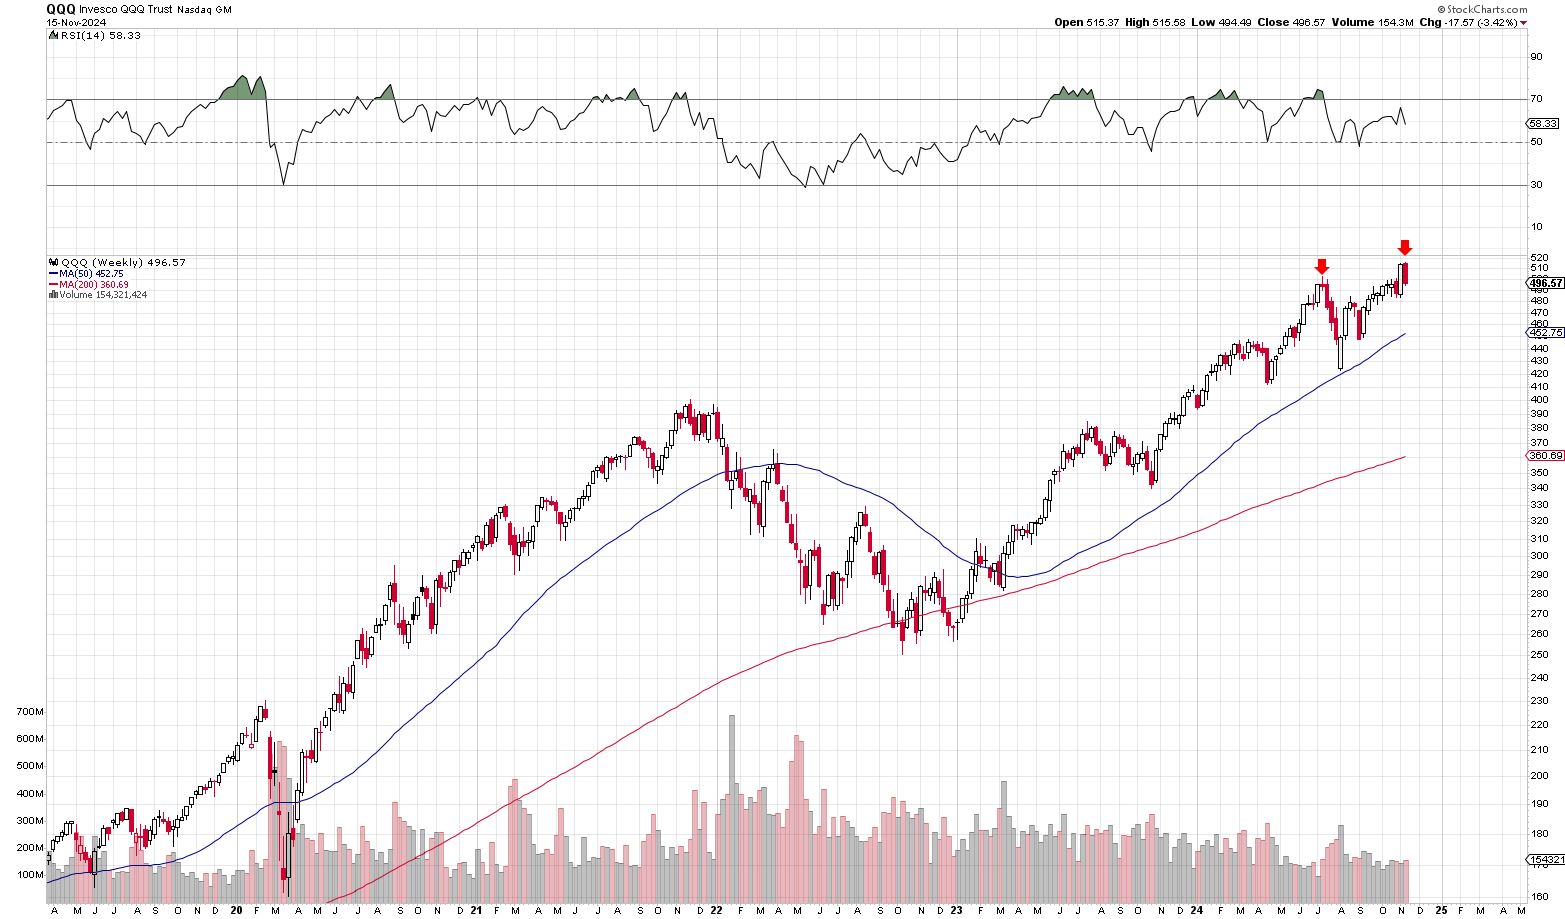
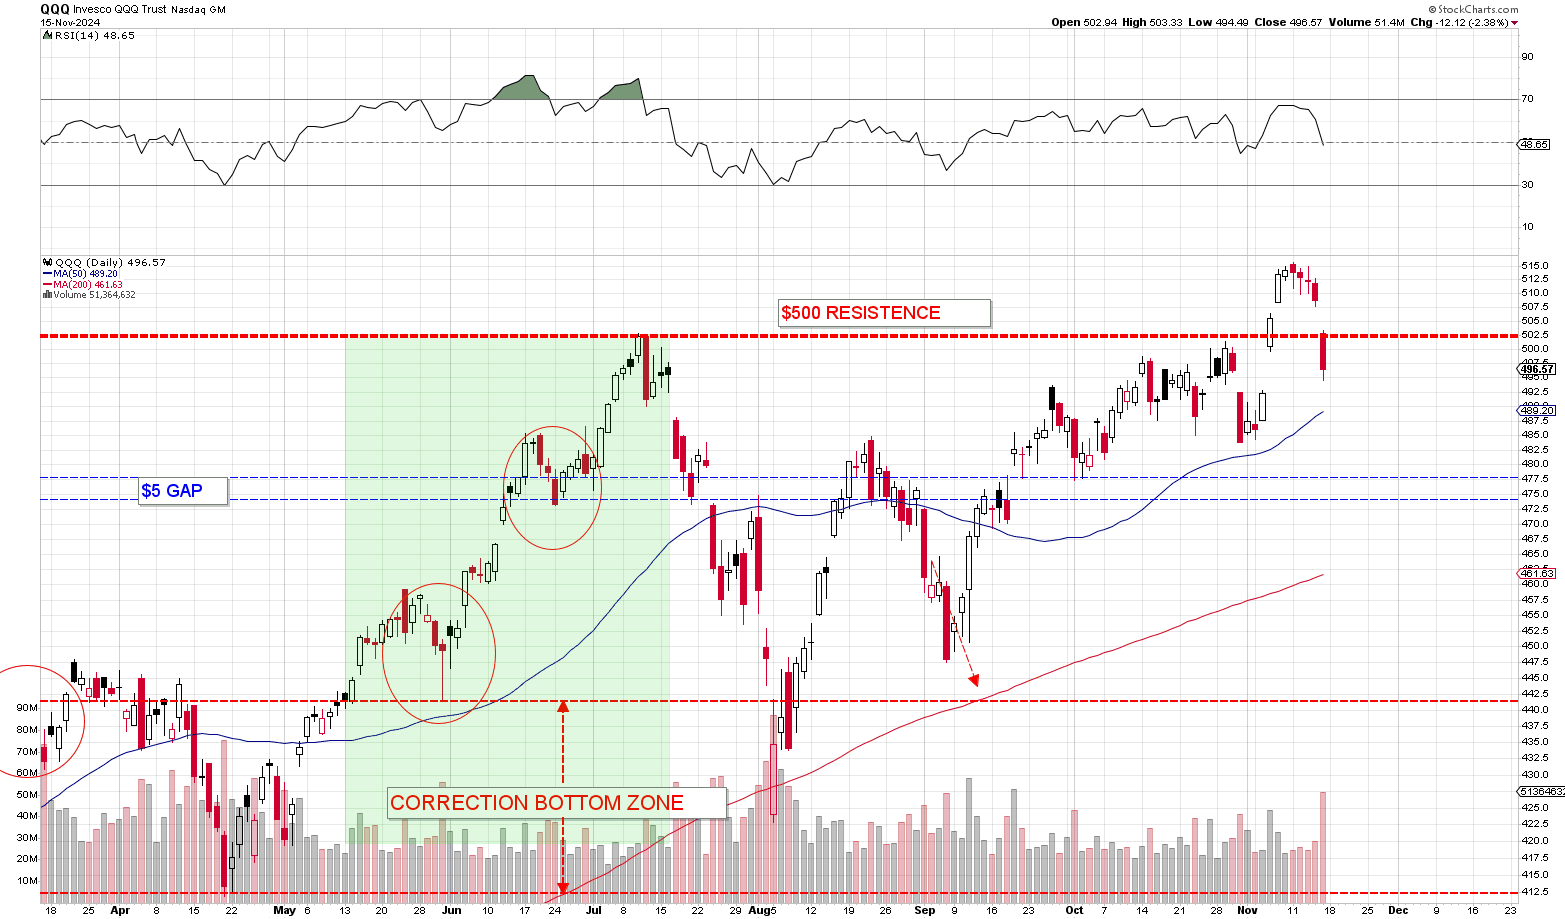
The implications of a potential double-top with a false breakout at $500 are dire. It’s not obvious just yet what to make of this and we do need to see more to draw any conclusions. For now, it’s just a potential issue if the QQQ does not retake the $500 level soon. But I’d file this as one big risk factor for the overall rally.
ISSUE #4: The Broader Market Indices Look Stronger than the NASDAQ
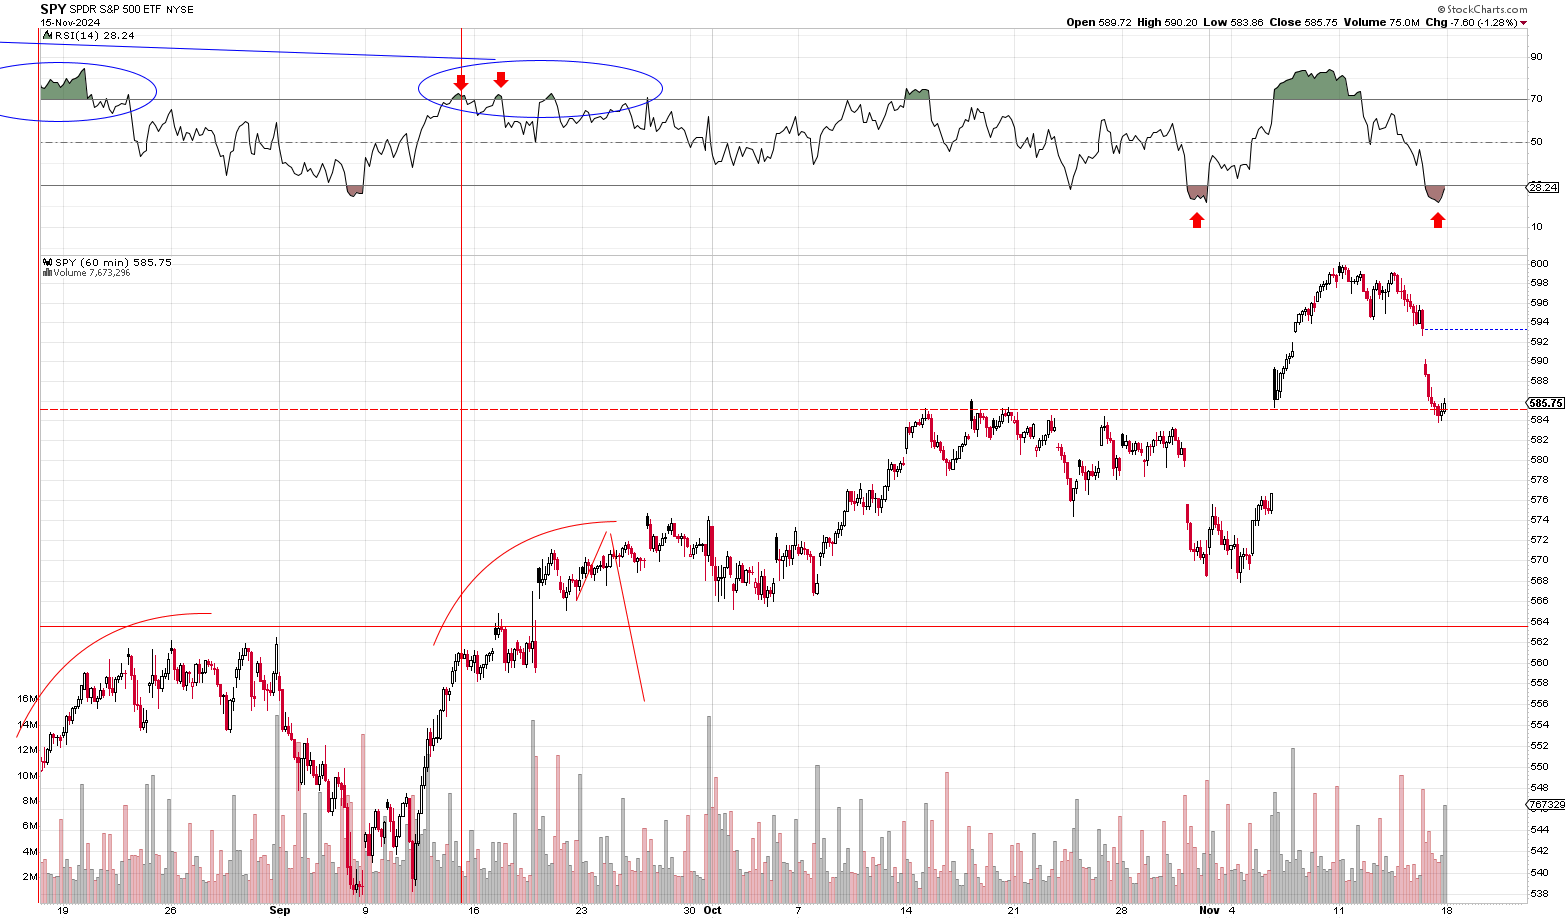
When answering the question of whether the NASDAQ-100 (QQQ) is headed for a correction, one major thing we need to always look at is how the Dow and S&P 500 are trading. Because we can’t really have one without the other. if the S&P 500 looks solid, then the NASDAQ-100 (QQQ) is not likely to top anytime soon. And that is exactly what we have here. While there are all sort of factors and issues pointing toward a potential peak on the NASDAQ-100 (QQQ), the S&P 500 (SPY) doesn’t suffer from some of those same issues. First, the S&P 500 — unlikely the NASDAQ-100 — has held its major support line. The SPY did get rejected from the $600 level, but it held its key gap-support at $585 a share (the QQQ filled the gap already) Furthermore, the SPY daily chart looks fairly in tact for the time being with the QQQ only giving back a portion of the post election gains. The QQQ almost fully gave back all of its post-election gains before recovering at the end of the sessions.
Obviously, how the SPY performs on this upcoming rebound can change all of that. If the SPY merely pushes up to the upper gap-line at $594 or something like that or if it fails on another retest of $600, then we have a potential double-top in play and the chances of a correction skyrocket. But for the time being, the SPY continues to look really bullish. Net-net, the SPY is substantially higher as of Friday’s close than it was ahead of the election. The same can’t be said for the QQQ:
ISSUE #5: Rate Concerns & the Issue of Tariffs
Recently, there were pieces of headline news that did have an impact on the market. These issues have the potential of leading to some future volatility. The include:
(1) Powell on Interest Rates — On November 14, Federal Reserve Chair Jerome Powell indicated that the Fed was in “no hurry” to cut interest rates, citing strong U.S. economic growth. This cautious approach led to Friday’s big decline in the market. Whether these comments were just an excuse for investors to take profits or the beginning of an OCD-type bi-polar focus for the market remains to be seen. But it’s an issue that we have to watch.
(2) Concerns Over Potential Tariffs — Now that the market has had time to absorb the election results, concerns about potential new tariffs have intensified, as they align with President Donald Trump’s broader trade platform. Analysts are projecting tariffs as high as 60% on Chinese goods and 10-20% on other imports. These anticipated measures, which reflect Trump’s longstanding focus on reshaping trade relationships to prioritize American interests, could significantly impact both the U.S. and global economies by driving up inflation and slowing growth.
The combination of the Fed’s cautious stance and potential trade measures contributed last week’s sell-off in the market. Several big investors expressed concerns over the sustainability of the post-election rally due to these issue.
For now, these are two key issues to monitor, as the market tends to hyper-focus on certain concerns, whether or not they ultimately materialize into significant problems.
NASDAQ-100 (QQQ) Intermediate-Term Outlook Conclusions
So here’s the main takeaway from all of this. A lot of words were written. Risks were stated. But I don’t want anyone to lose sight of what our ultimate thoughts are here or what our actual outlook is. As the intermediate-term is concerned, I think what we’re likely to see is another leg up in the market that leads to a double-top of some kind or a slightly higher high or something along those lines. We’re near the end of the market rally that began in August-September. Whether we categorize it as having began in August or September doesn’t change the fact that the overall chart is pointing toward a top happening fairly soon. While we expect the NASDAQ-100 to rebound all the way up to $530 in a final segmented rally, I can’t stress enough that our outlook confidence is somewhat low given the circumstances. We just believe there is a preponderance in favor of a final segment up to $530 over and above the risk of a correction taken hold. Just a preponderance.
That is because the reality is this. The QQQ fell over 4% from its peak at ~$516 and has seen multiple attempts and failures to breakout above $500. There is a genuine risk that after a small near-term rebound off of oversold conditions, the QQQ may just roll over and begin a correction. That risk creates an unavoidable cloud of uncertainty until we see how the rally unfolds. If the QQQ sustains a very strong rally that takes it well north of $500 fairly quickly, then great. The risk drops considerably at that point. But if the rally is half hearted and we see the QQQ barely limp above $500 a share in the coming days, then correction risk goes up considerably. We won’t know until we see it.
As we mentioned above, all of the trading action right now points toward a big rebound happening early in the week and the segmented rally chart suggests the QQQ may have already bottomed ahead of another big $40+ rally. That is a distinct possibility.
What is interesting to point out is this. Even if the QQQ just started a correction, we’d be about 1/3 of the way through in terms of both time and duration. A 10% correction would take the QQQ down to round $465 a share. We do have a gap to fill down to $470 (for those that remember). A correction really doesn’t change much in terms of any of our portfolios or strategies. We’ll discuss those strategies separately in the daily briefing.
Nvidia intermediate-Term outlook
If it weren’t for the fact that Nvidia is reporting earnings next week, our intermediate-term outlook for Nvidia would be for the stock to top out at $150-$160 given last week’s performance in the market. So as we mentioned above, Nvidia, like the QQQ, reached oversold territory and is due for rebound. We expect Nvidia to rebound up to at least $145 this week ahead of is earnings. It could go further depending on how the market performs. But I do think with last week’s volatility and the 67% returns in Nvidia from its $90 lows August, there’s a higher degree of risk that Nvidia is nearing an intermediate-term top ahead of another correction. Our plan is to sell covered calls against our Nvidia long positions as a hedge going into the report. The weight of the evidence, however, does point to Nvidia likely moving higher after earnings and peaking not long after. Again, as we’ve mentioned over the last few weeks, we don’t believe Nvidia will move substantially above $160 before its next earnings report in February and will likely sees an intermediate-term peak way before then.
The good news is that Nvidia tends to respond positively to earnings in the overwhelming majority of the time. Even when earnings are not great, the stock doesn’t tend to overreact on the downside all that often. Before this past August’s report — when nearly every big tech stock traded lower — you have to go all the way back to May 2022 to see an outsized negative reaction to earnings and that was around 5% and mid-bear market. Historically, Nvidia tends to perform very well on earnings. Bad reactions are around -5% and good reactions could see Nvidia move higher by anywhere from 5-15%. There’s generally a bullish bias to earnings for Nvidia.
The bad news is the market is currently on edge after last week’s sell-off and Nvidia’s valuation is nearly priced to perfection. There’s going to be a higher level of scrutiny on the report given Nvidia’s recent gains. What’s more, the trading action going into this report is looking strikingly similar to the action we saw going into the August report. Nvidia is trading in the same exact pattern but at a smaller sort of scale.
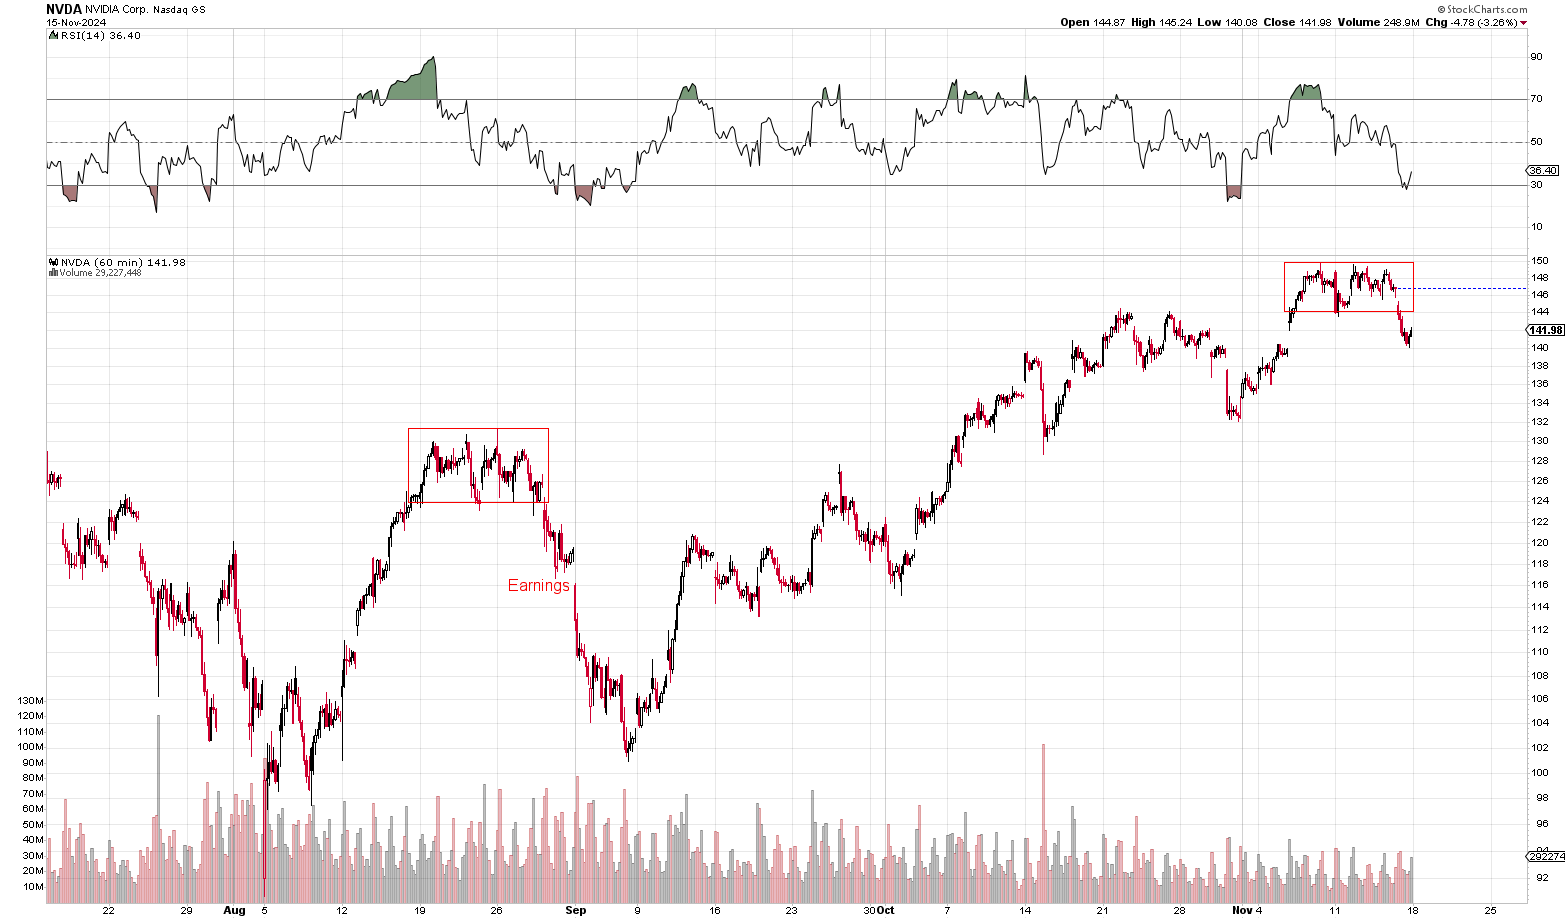
Ultimately, the numbers and report will control. The type of earnings environment we’re in has been favorable to stocks that report strong earnings. If Nvidia (NVDA) delivers, it will respond in kind unlike last quarter where all stocks seemed to drop regardless of the strength of the report. Both the market’s overall direction and the report itself will control.
What’s more, even if Nvidia were to sustain a correction after earnings, chances are it would be both short-lived and have a smaller overall impact compared to what we saw in August – September — as Nvidia is due for its next trading zone. Nviida saw its last peak price in June ($140) and has largely remained in that trading zone until the recent post-election rally. Nvidia is due to breakout to a new trading zone. This would mark the third earnings report of the same trading zone which in turn leads to a contracting forward and trailing P/E.
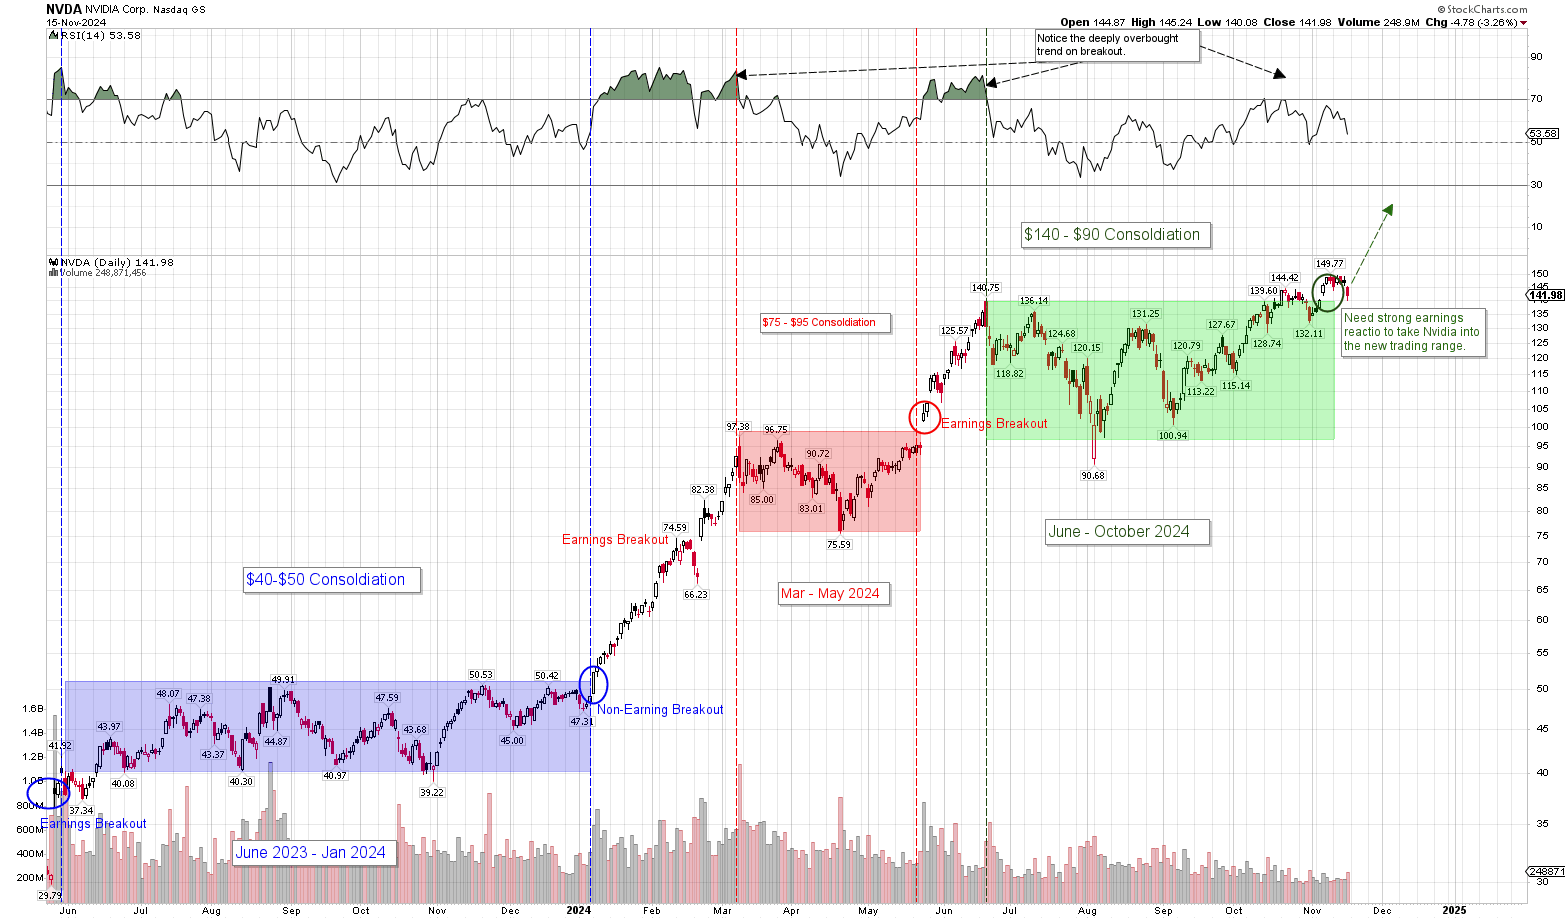
As we see it, while Nvidia (NVDA) has seen fairly substantial gains from its $90 lows in August, and while Nvidia might soon be due for a correction, that correction is probably on the smaller side of the spectrum. Nvidia could see one more pull-back within the $90-$140 trading range, but then it likely rallies through $150 and onto $160 by January anyhow. Whether Nvidia sustains a correction here and now or whether it does so after earnings will be determined in part by earnings and by the NASDAQ-100’s general direction.
But as we mention above, it doesn’t matter because Nvidia is headed in the same ultimate direction anyway and that is $150-$160 by January.
Investment Strategy & Model Portfolios
We’ll discuss our investment strategy in the daily briefing. We’re likely making a lot of trades this week in light of the increased risk of a correction. Please check the daily briefing for the investment strategy going into this week.

Hi Sam, thanks for all the articles. How do you feel about the current levels of the Shiller’s PE ratio? Although past performance is not indicative of future performance, it predicts that a huge move down will occur soon. I would love to hear your thoughts about this.
It’s a problem and has been since before the 2022 bear market which never fixed it. So here’s the way we address it. We view the CAPE ratio as being an existential risk to the portfolios which are hedged via puts.
Because the Shiller P/E can only indicate overvaluation without reference to any sort of timing mechanism, the way to approach it is to remain long while hedging out the risk.
Since there’s no timing element to the Shiller P/E ratio, if you exit the market due to valuation concerns, you potentially miss out in generational gains. The market can keep climbing indefinitely with an elevated CAPE ratio.
That’s the way we’re approach it. It’s an existential risk hedged out with a mix of puts, good entires (buying on corrections) and the 2-year rule. These things all address that risk.
Exciting week ahead!
Thanks for the read. Appreciate these weekly roundups. Always love to compare your analysis to my thoughts.
You provide good sources to your analysis and outlook. I wonder how long it will keep going up (QQQs) because the valuation is getting a sky high. I know the reasonable thing is to be long and hedge. Im currently debating waiting for another real 10% correction to buy next batch. The 500+ area on QQQs just looks so fragile.