the TL;DR Summary
As we head into the least couple weeks of December and January 2025, forecasting confidence has gone way up than where it was back in October – November when markets were trading sideways. We have a lot of strong arguments in support of our forecasts for both short and intermediate-term direct of the NASDAQ-100 (QQQ) and Nvidia (NVDA).
Notice that whatever happens in the NASDAQ-100 (QQQ) largely impacts all stocks across the board, and tech stock more specifically. We spend our time on the NASDAQ-100 (QQQ) precisely because the analysis broadly applies to virtually all large cap and mid-cap stocks.
For the short-term, our expectation is that the market will soon begin a sharp short-term pull-back that will last anywhere from 3-5 trading days. The sell-off will be swift and fairly substantial at 3-4% for the NASDAQ-100. This will likely cause Nvidia (NVDA) to trade down to as low as $127-$129 a share depending on when that pull-back begins.
But after that pull-back happens, we expect the markets to rally for a period of 3-4 weeks where the entire market will then peak and sustain a typical 8-12% correction. Again, we have fairly high confidence in that forecast. This rally is likely to push the QQQ up to as high as $540-$550 and Nvidia up to around $150 a share or higher. But at that point, the market rally will end and we’ll see a 10-12% correction which will then lead to another intermediate-term rally that lasts several months.
Below, we outline the near-term outlook for the NASDAQ-100 (QQQ) and Nvidia (NVDA) and follow up with the intermediate-term outlook for both.
FORECAST: NASDAQ-100 (QQQ) Likely Headed for a 3-4% Pull-Back within the next 1-2 Weeks
he NASDAQ-100 (QQQ) is likely going to sustain a 3-4% peak-to-trough pull-back during the next 10-trading sessions. We are at the very end of the segmented rally that started in mid-November at $494.49 a share on the QQQ. This represents our firm near-term forecast. While we believe the QQQ can potentially run to as high as $535-$540 before peaking, it is far more likely that the index peaks either just ahead of or immediately after the fed. If the NASDAQ-100 (QQQ) peaks at $535 or under as expected, then the pull-back should extend to a low of $512 to $517 a share. This is likely to put heavy downside pressure across large tech names like Apple, Tesla, Netflix and others that have recently gone on substantial runs. How much this impacts Nvidia remains to be seen. We’ll discuss that more below.
HIGH/MODERATE FORECASTING CONFIDENCE
We have a high-to-moderate confidence in our forecast given the various arguments we’ll be outlining below. If it weren’t for the fact that the Dow is on a 7-day consecutive losing streak, we’d have a full high confidence in our forecast. Setting that and some of the other risk factors aside — which we’ll discuss below — the evidence supporting our forecast is substantial and that is the reason for our high forecasting confidence in the Current Near-Term Outlook.
Segmented Rally Cycle Analysis
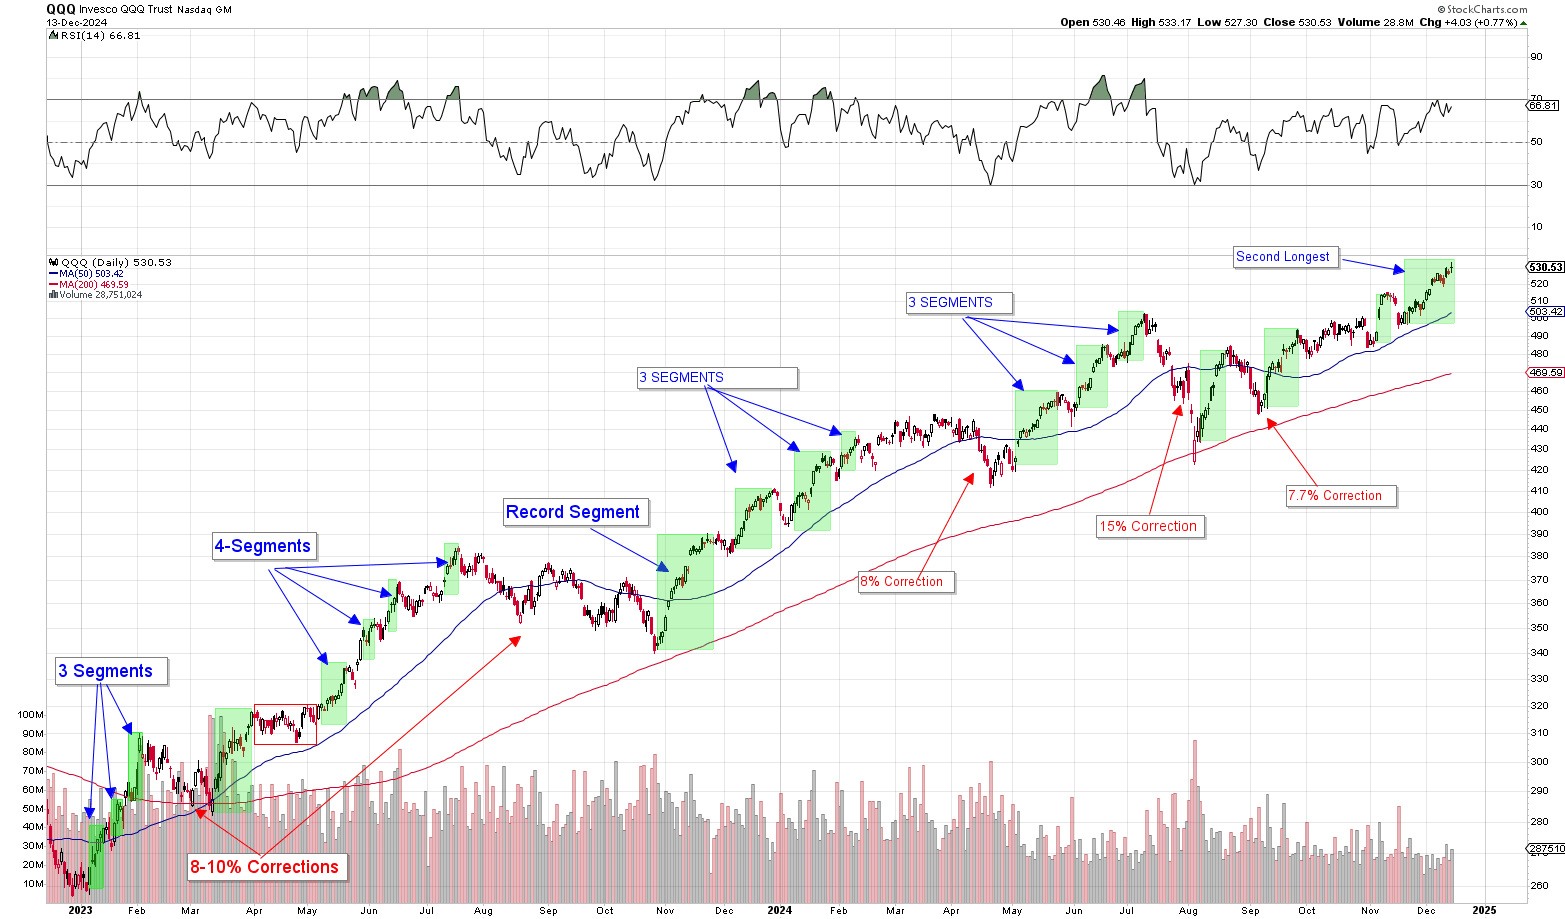
As most of you know already, the Segmented Rally Cycle analysis is suggesting that we’re at the very far end of the range as this rally is concerned. When closing analyzing at how the NASDAQ-100 (QQQ) has traded over the last two years since the start of this bull market, one will quickly discover that the NASDAQ-100 mostly trades in very precisely up and down segments. The NASDAQ-100 doesn’t just climb indefinitely or drop indefinite or trade sideways or trade randomly. Instead, what it tends to do is produce large 20-30% returns over 70-100 session of periods of time. And within those 70-100 trading day cycles (intermediate-term rallies), the QQQ will experience anywhere from 2-5 smaller rallies lasting 12-20 sessions each with small pull-backs in-between each such rally lasting anywhere from 3-5 sessions.
Currently, the NASDAQ-100 is at the very end of one of those short-term rally segments. In fact, as of Friday, December 13th’s close, the current rally has extended to 20-sessions making it the second longest straight rally going back to 2022. At a return of 7.8% of that period of time, the NASDAQ-100 rally is exactly in-line with the typical 8-10% average for these segments. The table below outlines each segment in chronological order going back to the 2022 lows of the last bear market:

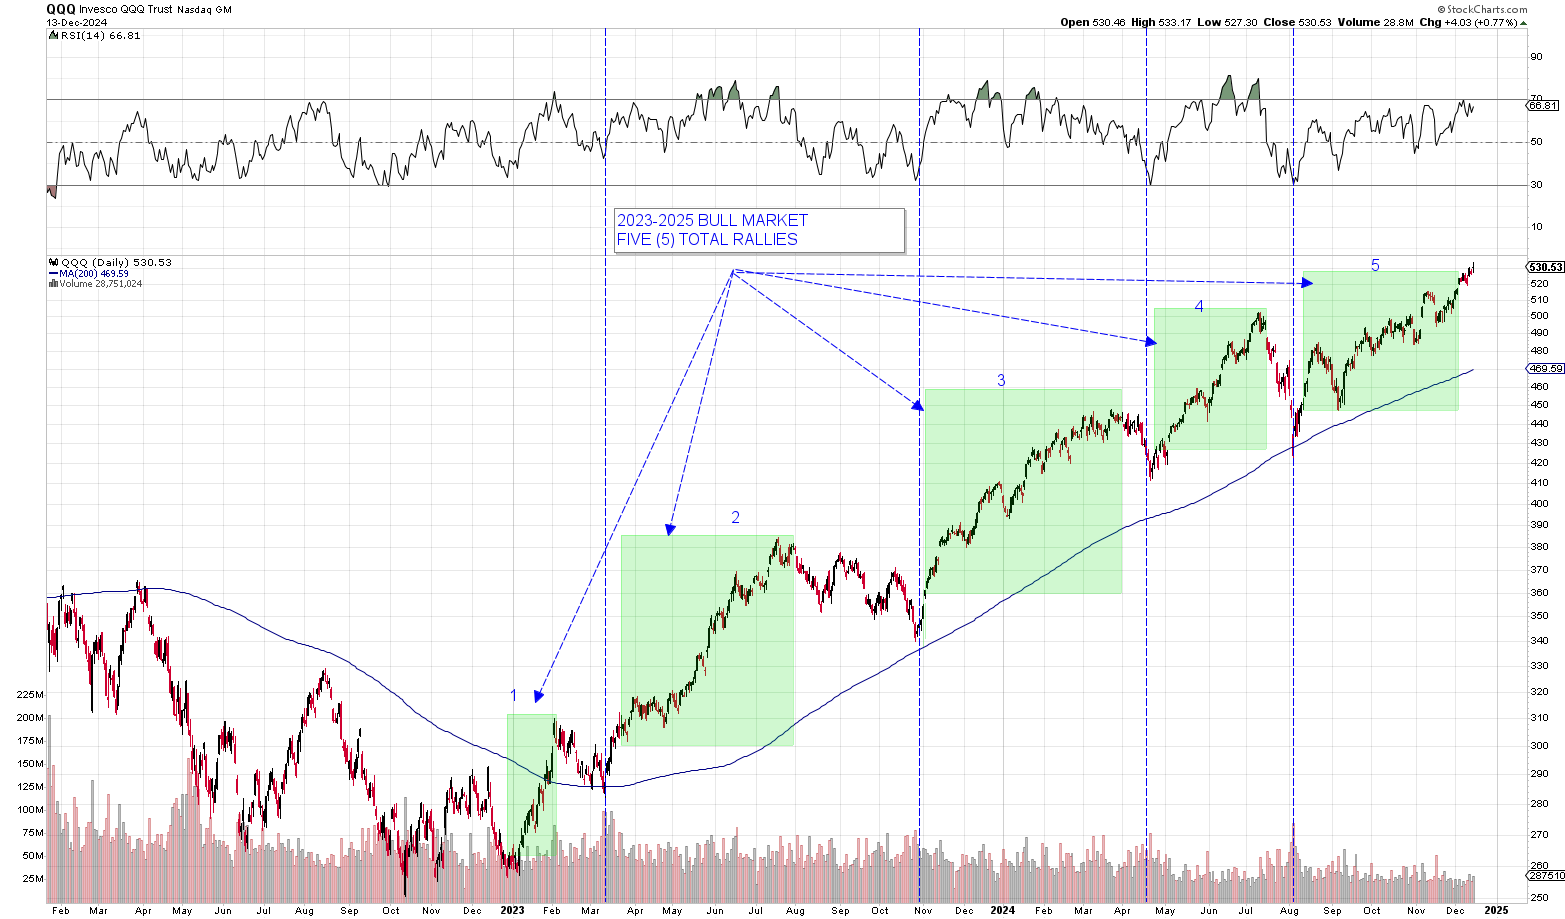
Below is a chart that shows each of these segments going back to the lows of December 2022. What you’ll notice is that the entire bull market can really be viewed as SIX (6) major rallies with FIVE (5) major corrections separating those rallies. And within each of the six rallies, we have anywhere from 3-5 rally segments. For example, the first rally went from $250 up to $310 a share and occurred between December 2022 and February 2023. Within that rally, we had 3 segment and a 10% correction. The second rally went from early march 2023 all the way until July 2023. That was the largest consecutive move up we’ve seen in the market without a correction going back to 2010. The market rallied 36% straight up without a 5%+ pull-back at any point in time during the period.
Negative Divergence Cycle
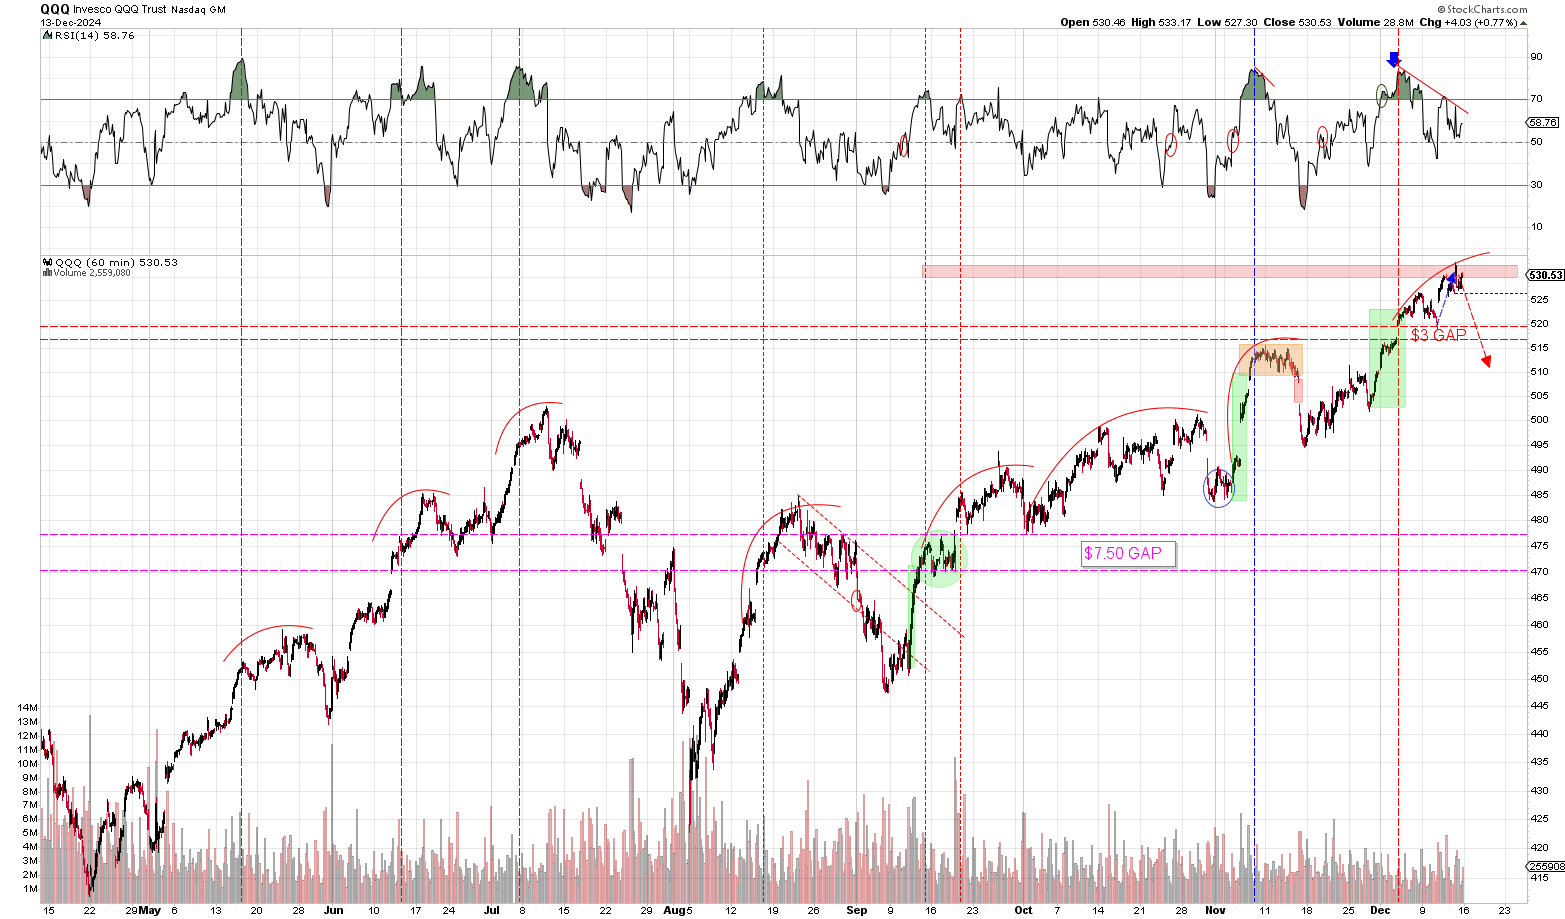
Separately, we have the negative divergence cycle which points toward a peak in the QQQ. When observing the 60M (1hr) chart time-frame, there’s a clear pattern that emerges with the QQQ. And that is this. Whenever the NASDAQ-100 reaches extremely overbought territory as indicated by a deep push above the 70-RSI mark and up to the 80+ RSI level, a countdown begins wherein the QQQ reaches a price-peak shortly thereafter. An overbought RSI rarely indicates a peak in price in the QQQ. But what it does do is tell us that the QQQ will often peak very shortly thereafter. And that is especially the case when the QQQ experiences negative divergence — new highs in price without a coinciding increase in momentum.
As an analogy, the way to think about momentum is in the same fashion as one considers momentum in physics. A speeding car must slow down before it stops even when slamming on the breaks. An airplane approaching a stall will lose speed, gain altitude and eventually peak. Same sort of concept here. A peak in “speed” could be thought of as momentum whereas a peak in price is the peak in altitude in the analogy.
The chart below shows this quite clearly. The QQQ has been on negative divergence since the RSI peaked with the QQQ near $520 a share. Each of the vertical lines in teh chart below indicate a peak in upward momentum on the QQQ. Notice how this often precedes a peak in price but rarely indicates that a peak is in:
Fed & Trend Shift
A third big reason for expecting a short-term sell-off soon is the FOMC meeting and statement release is often a point where the market tends to shift directions. Historically this has been true for a very long time. It doesn’t mean the fed always marks some of a peak. But if the market is ready to pull-back, it will often wait for the fed before doing so.
Right now, the QQQ is ripe for a sell-off, but we could very easily see the ETF rise until the fed statement on Wednesday. Especially with the Dow on a 7-day losing streak. We could see the Dow snapback rally into the fed with the components putting upside pressure on the NASDAQ-100.
Also, while the market is expecting the fed to pause in January, there could be forward looking statements the market coming out of the press conference that the market finds disagreeable. More than likely, the fed decision will just be an excuse for the market to pull-back a little.
MODERATE FORECASTING CONFIDENCE
We have a slightly lower confidence rating on the Nvidia near-term outlook due to the fact that Nvidia did reach oversold conditions last week. And as we’ve shown repeatedly, whenever Nvidia reaches oversold territory, it tends to rebound BIG TIME. The last five times Nvidia reached oversold territory it rallied $15-$20. Now while Nvidia did not reach deeply oversold territory, it did touch down to the 30-level twice. Add the Dow situation to the mix and we have a little bit of uncertainty in the forecast. Realistically, we think what could easily happen is a rebound earlier in the week on the back of these factors followed by a big sell-off starting later in the week due to the QQQ 3-4% expected sell-off.
Nvidia (NVDA) Oversold Analysis
As we mentioned in the forecasting confidence, Nvidia reached oversold territory twice last week all on the same leg lower. And last time we were here at the end of November, we illustrated just how strong of indicator oversold territory is for Nvidia. In fact, what we pointed out ahead of this most recent rally in Nvidia is that the stock tends to rebound anywhere from $15 to $20. This was in the most recent Current Outlook for Nvidia. I’m literally deleting the previous chart pointing toward a huge rally. The huge rally came and went and now here we are with Nvidia reaching oversold again. I’m copying and pasting this content here from the last current outlook and adding the most recent rebound to the list:
Nvidia Recent Rebounds off of 60M Oversold Territory
$100.94 to $120.79 (+$19.85)
$128.74 to $144.42 (+$15.68)
$132.11 to $149.77 (+$17.66)
$137.35 to $152.89 (+$15.54)
$131.80 to $146.54 (+$14.75) – most recent
The chart below is a good visual representation of the power that hourly oversold territory has on Nvidia near-term. As you can see, Nvidia reached oversold territory on the hourly chart. Once when it first fell back to $137 and against when it hit $133.79. Nvidia did not reach oversold territory on last Friday’s sharp pull-back and can even arguably said to have established positive divergence. See below:
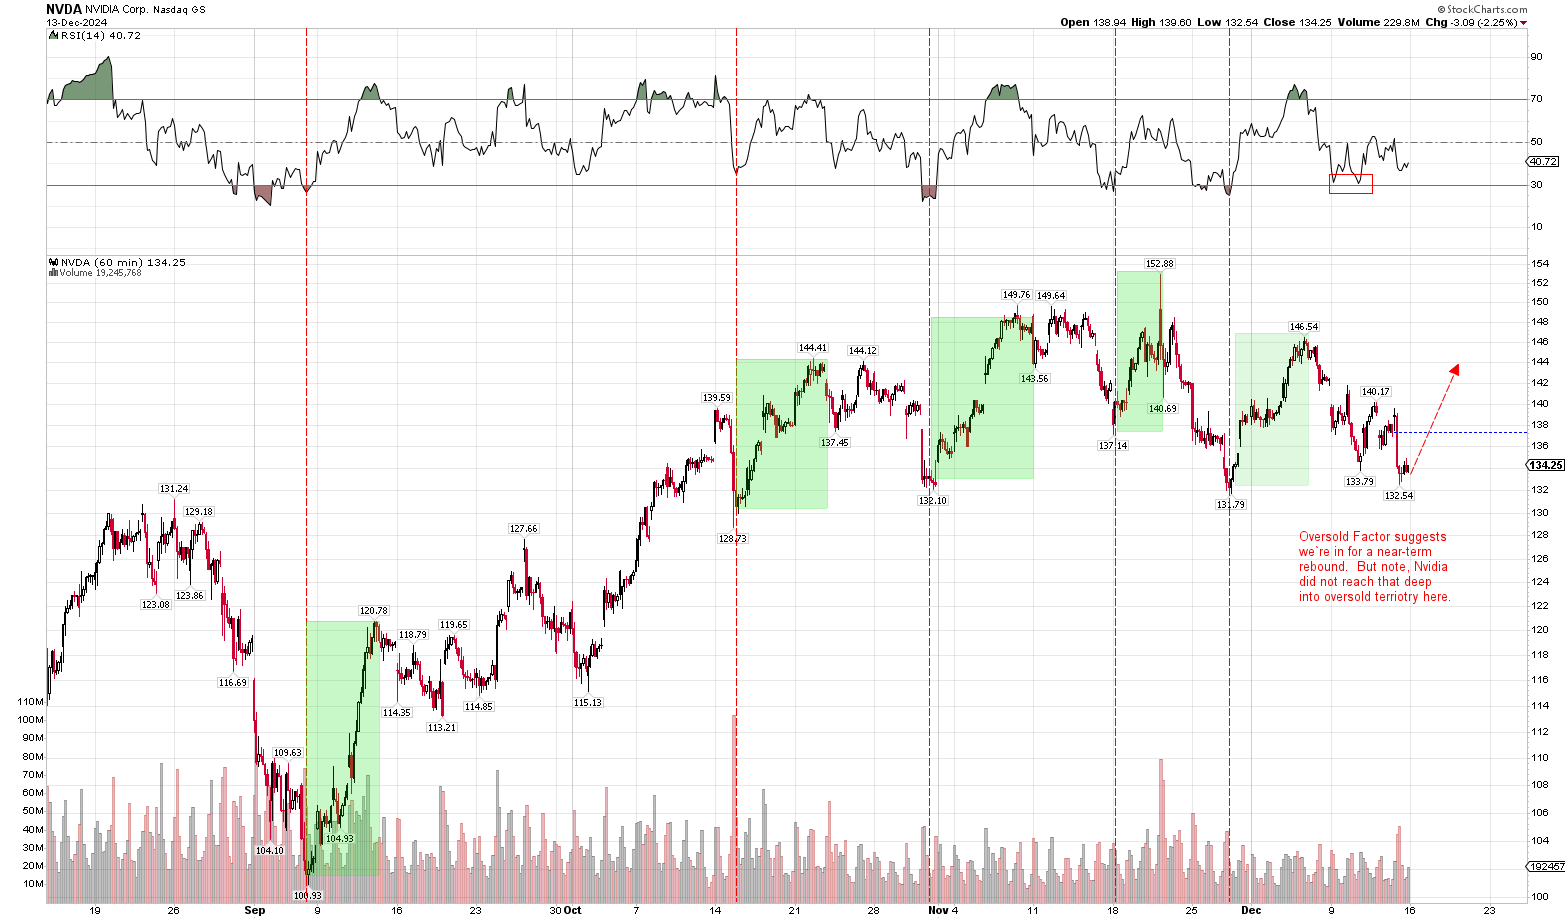
As you can see from the chart & informal table above, the last FIVE times we saw Nvidia oversold, it had a near immediate snap-back rally of $15-20 points each. That being said, one must recognize that Nvidia only just barely reached oversold territory. That sort of cuts against the strength of the evidence generally speaking. The selling wasn’t as aggressive this time around. So from a pure contrarian point of view, the evidence isn’t as powerful as it was on the other five cases.
Furthermore, as we pointed out in the NASDAQ-100 (QQQ) section above, with a QQQ pull-back imminent, I’m not so sure Nvidia gets very far on a rebound before its pushed right back down on the selling pressure.
Nvidia (NVDA) Price-Target & Near-term buying Opportunity
It’s worth nothing that if Nvidia does sell-off with the NASDAQ-100 (QQQ) as expected, it will represent a big buying opportunity. We do expect to see at least one final segmented rally following this upcoming pull-back cycle. During that rally, Nvidia should make another push up toward the $150 level. This will especially be the case if Nvidia reaches extremely oversold territory as it did near the end of November.
In terms of our expected price-target, depending on where the NASDAQ-100 (QQQ) ultimately peaks, we expected Nvidia would likely lose the $130 level on the next pull-back and find support near the $126-$129 area. Again, that assumes the NASDAQ-100 (QQQ) peaks sooner rather than later. If the QQQ drifts higher than expected before peaking ahead of the fed, we could see Nvidia rebound toward the $140-level by the time the QQQ peaks. In that case, we could easily see Nvidia hold the $130 level on the upcoming market-wide pull-back. Regardless, we don’t think Nvidia spends much time trading under the $130 level in the near-term.
HIGH CONFIDENCE FORECAST
As we note above, we have high confidence in this forecast. The reason for that is simple. The strength of the evidence points toward the fact that the NASDAQ-100 (QQQ) is at the very end of its most recent rally that began in September and that we will soon see a regular 10% correction that begin sometime between mid-January and early February. We’ll outline those reasons below.
Intermediate-Term Rally Analysis
As we’ve mentioned several times both in the Daily Briefing and Weekly Roundup, the NASDAQ-100 (QQQ) tends to follow a broad rally-correction cycle where the index seems to always progress in either a decisive upward or downward trajectory. Rarely does the NASDAQ-100 (QQQ) spend any prolonged period of time consolidating as it did between October and November. It may spend a few weeks trading sideways every once in a while, but in most cases it is either in full blown rally mode or correction territory. And the corrections typically happen immediately after the rallies end. There aren’t long drawn out periods where the market consolidates at the lows. It’s almost always an immediate snap back rally right back up toward the highs.
Now every rally going back to 2010 has taken one of two very common forms. Every rally can be categorized as a “melt-up” rally or as a “high volatility” rally. These are very real categories with very consistent trends.
Melt-up rallies are marked by periods of extremely low volatility where the market just grinds higher almost every single day. During melt-up rallies, the average daily gain falls within 0.17% to 0.20% over a very long period of time. Corrections are smaller and there are no segmented rallies. In fact, anything larger than a 2% pull-back is considered significant. We haven’t seen a true melt-up rally since 2018. Those rallies all occurred between 2012 and 2018. The era before 2012 was marked by extremely high volatility and the period after has been nearly as high. It’s as if 2012 to 2018 was its own type of period marked by low economic risk and high liquidty.
High volatility rallies are marked by periods of moderate to high volatility where the stock market tends to move both up and down in very explosive fashion. Hence the rally segments. During high vol rallies, the average daily gain usually falls between 0.25 to 0.5% with 3-4% pull-backs and 10% corrections begin the norm. We know we’re in a high vol rally between the current rally sits at a 0.28% average daily gain which is nearly 50% higher than what we see in melt-up environment. Furthermore, we’ve already seen a few 3-4% pull-backs — something never seen in melt-up rallies.
Now the reason we point this out at all is to give color and context to the table below. This table below shows every single rally and correction going back to August 2010 — back to the beginning of the post-financial Crisis bull market run. Normally, we post this table in chronological order, but today we’re sorting it by “rally duration.” What this table should illustrate is that in terms of duration, this current rally that started in September is now fairly long in the tooth when compared to other high volatility rallies. As high volatility rallies are concerned, the 100-day mark represents the extreme far end of the curve. High volatility rallies typically end at the 40-70 day trading mark with 70-days being the overall average and median. The current rally sits at 69 trading days and January 29, 2025 would represent 100 trading sessions. Hence why we believe this intermediate-term rally is likely to end no later than mid-to-late January:

As you can see, in terms of “duration,” this rally has slightly surpassed the median. The blue highlighted dates represent the other rallies of the current bull market era that began in January 2023. In terms of this current bull market standards, the rally is about 20-30 sessions shy of where those rallies ended at day 89 and 100. But then again, it’s hard to compare this current rally to those two behemoths due to the fact that those were the first two major rallies of the era. Notice that all of the rallies north of 100 trading sessions represents all of the melt-up rallies of 2012 to 2018. Notice the average daily gain of those rallies were in the 0.13-0.20% for those rallies.
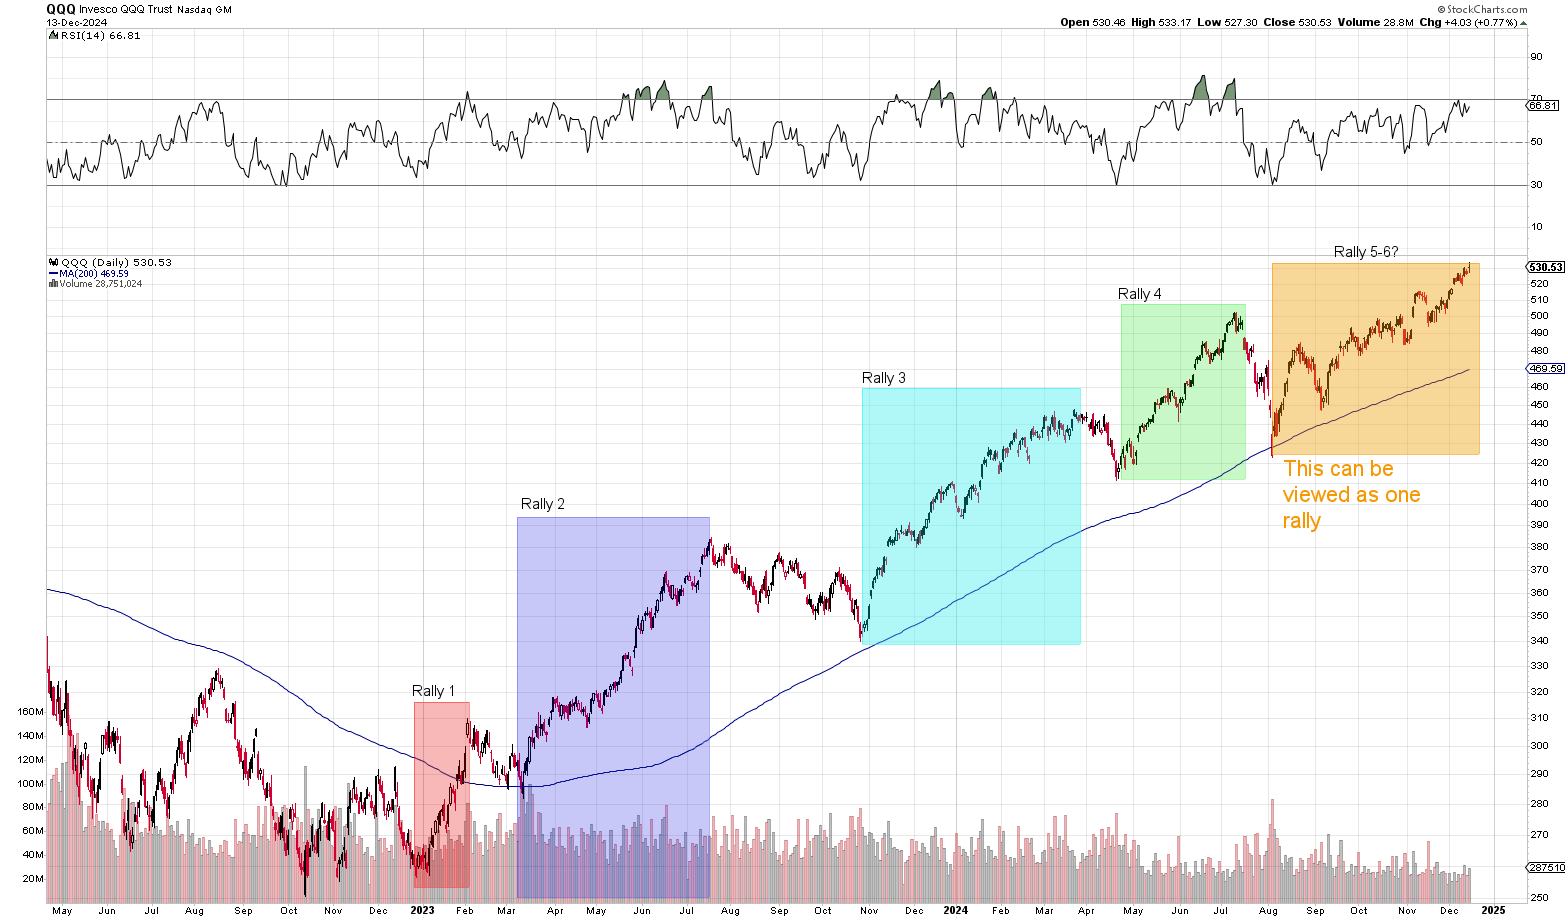
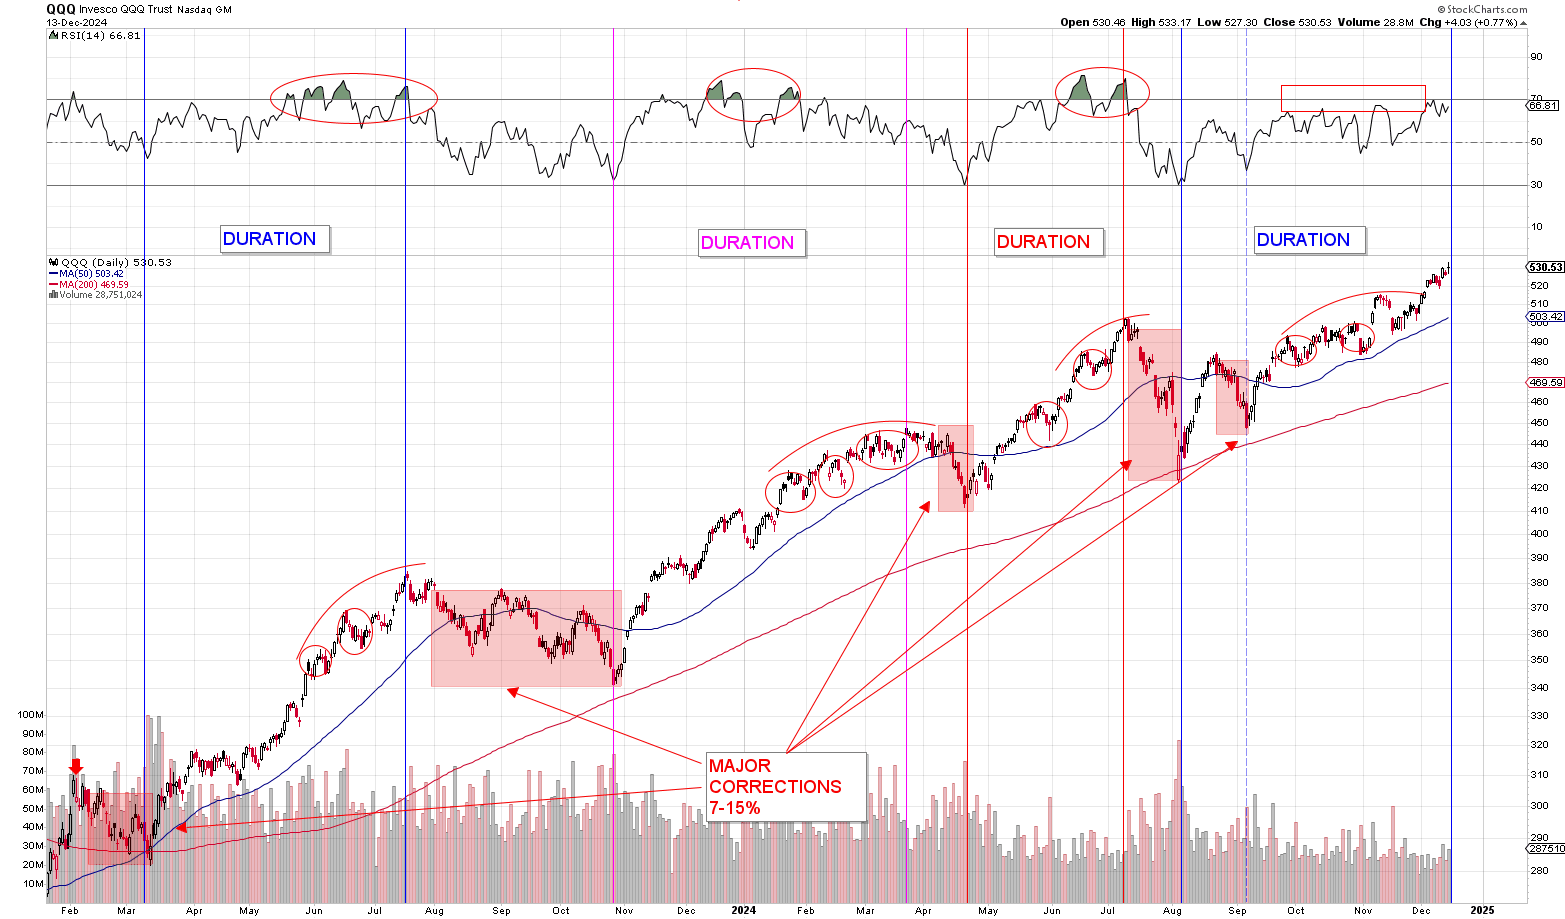
To give a more visual representation of “duration,” the chart below shows every rally in this bull-market era and their ensuing corrections. As we’ve mentioned before, when looking at this from a visible perspective, the chart looks very much like the August – September rally can be included in this current run. When looked at it that way, we’re already nearing 100% sessions today. Regardless of how we view the August -September segment, the broader point is the QQQ is likely going to sustain a full-blown correction by no later than mid-January to early-February on the long-end. At the short-end, we could see a correction right at the start of the year and it would’t be the first time that this has happened:
December Seasonality
December is generally a very positive month for stocks and we rarely if ever see a sell-off begin in the month of December. In fact, as we showed in our December 5, 2024 Daily Briefing, we’ve only ever seen a solitary instance of the stock market selling of in the month of December. It almost never happens.
In fact, December often acts as a conformist month, mirroring the current broader market trend while setting the stage for a potential trend reversal. Historically, if the market is trending lower going into the month, December typically follows suit. If the market is trending higher, then December continues that upward momentum. It’s a “go-with-the-flow” type month, often reflective of the market’s general direction.
What’s particularly interesting about December is its role in marking trend changes, however. Especially during sell-offs. When market corrections start in September or October, December frequently marks the bottom, as seen in 2011, 2018, and 2022—three years where December was notably negative but ended the downtrend.
On the flip side, December has also coincided with market peaks, often occurring during topping consolidation phases, with the subsequent sell-off unfolding in January. We’ve seen this happen on at least 7 occasions over the last 25-years. The red lines on the chart below highlight this recurring December pattern:
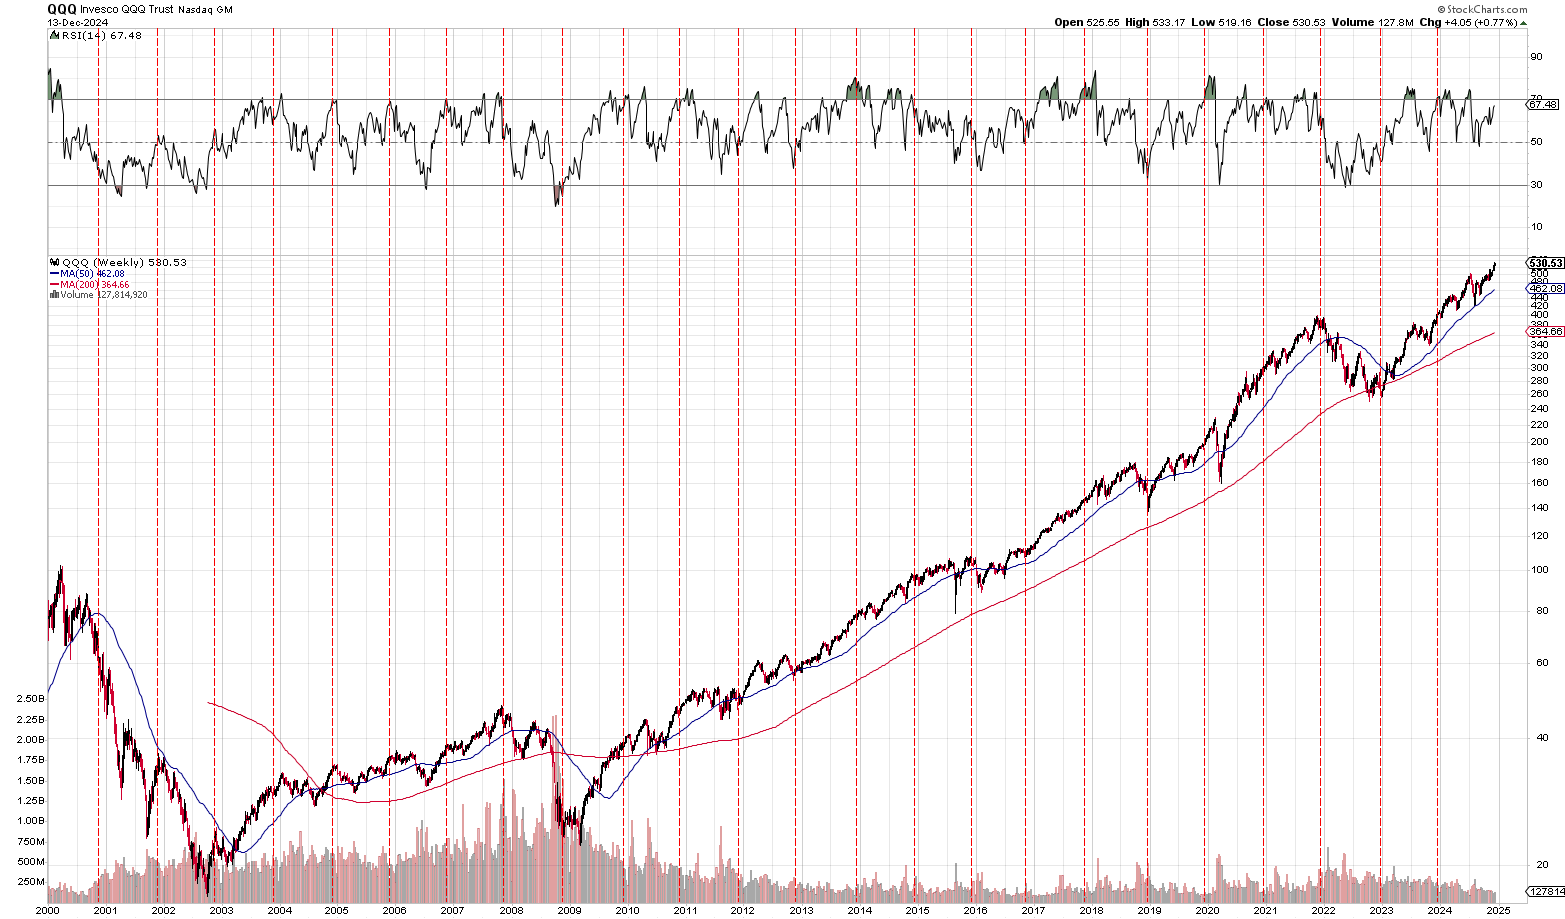
The key takeaway for December seasonality is this. First, we’re unlikely to see any sort of major sell-off in the month of December. If the market is gearing up for a correction, it’s going to happen in January. The seasonality is very strong in December.
But it’s also important to point out that December seasonality could be masking some negative issues developing under the hood and those things are likely to surface in the month of January.
HIGH-MODERATE FORECASTING CONFIDENCE
We are roughly 70-75% confident I our forecast as the evidence is clear and convincing. If it weren’t for the fact that the first quarter of the year is usually bullish for Nvidia or the fact that Nvidia is due to breakout to a new trading range, we would have a higher confidence rating on the forecast. There is strong conflict evidence pointing in both directions with the balance of evidence indicating that Nvidia ultimately runs to $170 after a period of heavy volatility.
Nvidia Trading Range Analysis
Nvidia has a tendency to oscillate within a broad trading range over a period of 3-6 months before ultimately breaking out toward trading a new trading zone. It has done this for the last few years now. The chat below shows all of the previous trading ranges. The current range began when Nvidia reached $140 a share back in late June and has been fighting to break out of that range of the better of 6-months now. Take a look below:
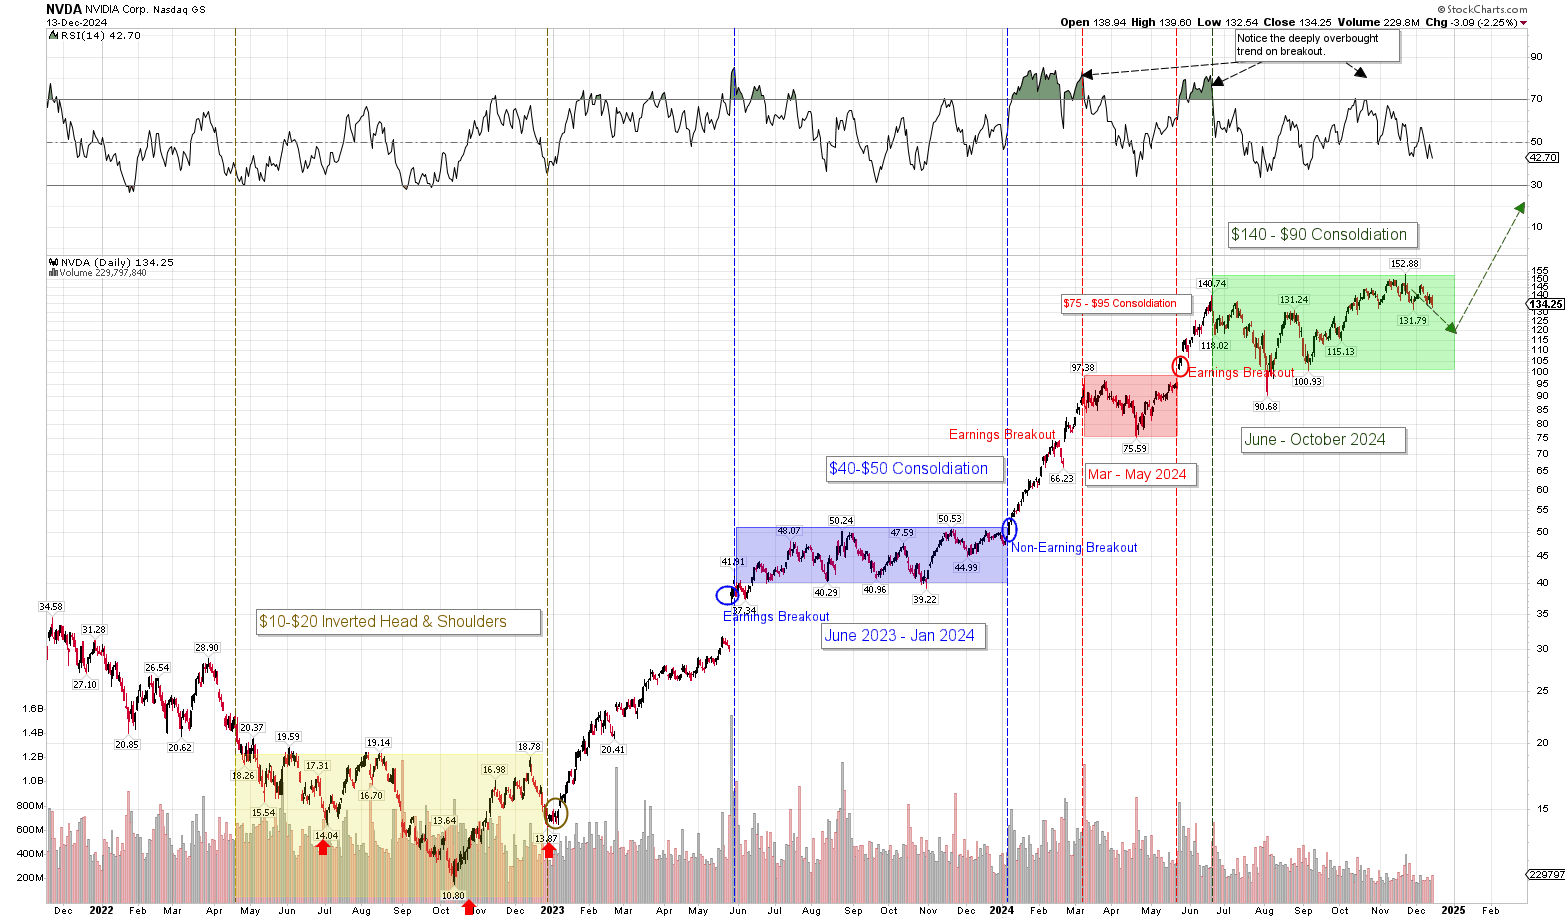
Now if you take a close look at the chart above, what you’ll find is that Nvidia underwent a very similar consolidation phase between June 2023 and January 2024. With the same exactly tail-end sideways trading right near its highs as it entered into 2024. Then BAM! Right when the stock entered into 2024, it went on a massive run doubling in value in just a short 4-months time.
Now I think this chart here presents the strongest argument for Nvidia going into a huge breakout run during the first and second calendar quarters of 2025. In fact, what will be interested to see is what the strong January – March seasonality does for Nvidia given the imminent market correction we’re likely to see in January – February time-frame.
Correction Impact on Nvidia Intermediate-term direction
As we mentioned the NASDAQ-100 (QQQ) section above, the market is very likely going to see a correction no later than February. It’s pretty much a foregone conclusion this point. Even if the market somehow bucks the trend, it won’t be for long. There WILL be a major correction early in 2025.
Now unlike the corrections we saw in April and July, I don’t think this correction is going to have as large of an impact on Nvidia as it had back then. In May through July Nvidia had just rallied from $750 a share up to $1400 a share split-adjusted. The stock nearly doubled in value in just 2.5 months. The stock falling 35.7% is totally normal given the scope of the run it had just sustain. So natural we forecasted that it would see such a correction.
The September correction of 23% is probably more in-line with what we could expect to see out of Nviida in a broad market wide 10-12% correction. With less built-in profits and with the stock largely having consolidated, it is unlikely to see anywhere close to the same volatility it sustained in July – August 2024.
So the question is: how far will the correction take Nvidia?
Now as we noted in the near-term outlook, the answer to that question largely depends on how far the next segmented rallies goes on the QQQ and the price at which Nvidia peaks ahead of the correction. If the QQQ final segment reaches our $540-$550 price-range, Nvidia probably peaks closer to $150 and likely bottoms at $120 in the next correction.
But if Nvidia struggles along with the QQQ heading into year end and the correction starts a lower price point, then it’s’ very possible Nvidia gets down to $110-$115 in the next correction.
Normally, what should happen is the stock should bottom out at a substantially higher level than where it bottomed in the preceding correction. So ideally, Nvidia should bottom at around $120 in the next correction which would be $30 above the prior low of $90.00 in August 2024.
Nvidia to Surpass Apple & Microsoft in Earnings
As we’ll outline in the Nvidia stock section, Nvidia is likely to surpass both Microsoft and Apple in net income by the end of calendar 2025. In 2026, it will be a straight beat on the full year. Now given this trajectory, Nvidia has a lot of upside pressure in the long-term. Normally, this would be a long-term consideration and an argument in support of the long-term price-target, but it’s also important when it comes to analyzing the consolidation-breakout trend analysis we’ve posted above. That trend likely remains in tact and continues on into calendar 2025 due to the continued rise in earnings and earnings expectations for next year.
Furthermore, with Apple trading at a 3.75 trillion market cap, this indicates that Nvidia could easily push up toward a $4 trillion market cap as the company will surpass Apple in earnings on a quarterly basis next year and on an annual basis in 2026. This is in-line with our $160-$170 price target during the first half of this year.
Trades on Watch
As we noted in last Thursday’s daily briefing, we’re presently watching several momentum stocks, including Applovin Corp (APP), Twilio (TWLO), MicroStrategy (MSTR), Reddit (RDDT), Palantir (PLTR), and Netflix (NFLX). However, considering the market is about to pull-back, we may initiate trades in these stocks following a 3-4% pullback in the QQQ.
Here’s a brief overviews of the stock’s we’re currently watching:
Netflix Inc (NFLX): Netflix is a leading streaming service with a vast global subscriber base. The company’s continuous investment in original content and strategic market expansions have driven significant revenue growth, with recent reports indicating a 6.67% increase in revenue to $33.72 billion and a 20.39% rise in earnings to $5.41 billion. With the stock looking to test the $1,000 level, we could see a big surge on a breakout similar to what we saw with Tesla when it busted through $1000 and Nvidia when it broke through $1,000 last year.
Trade Charts
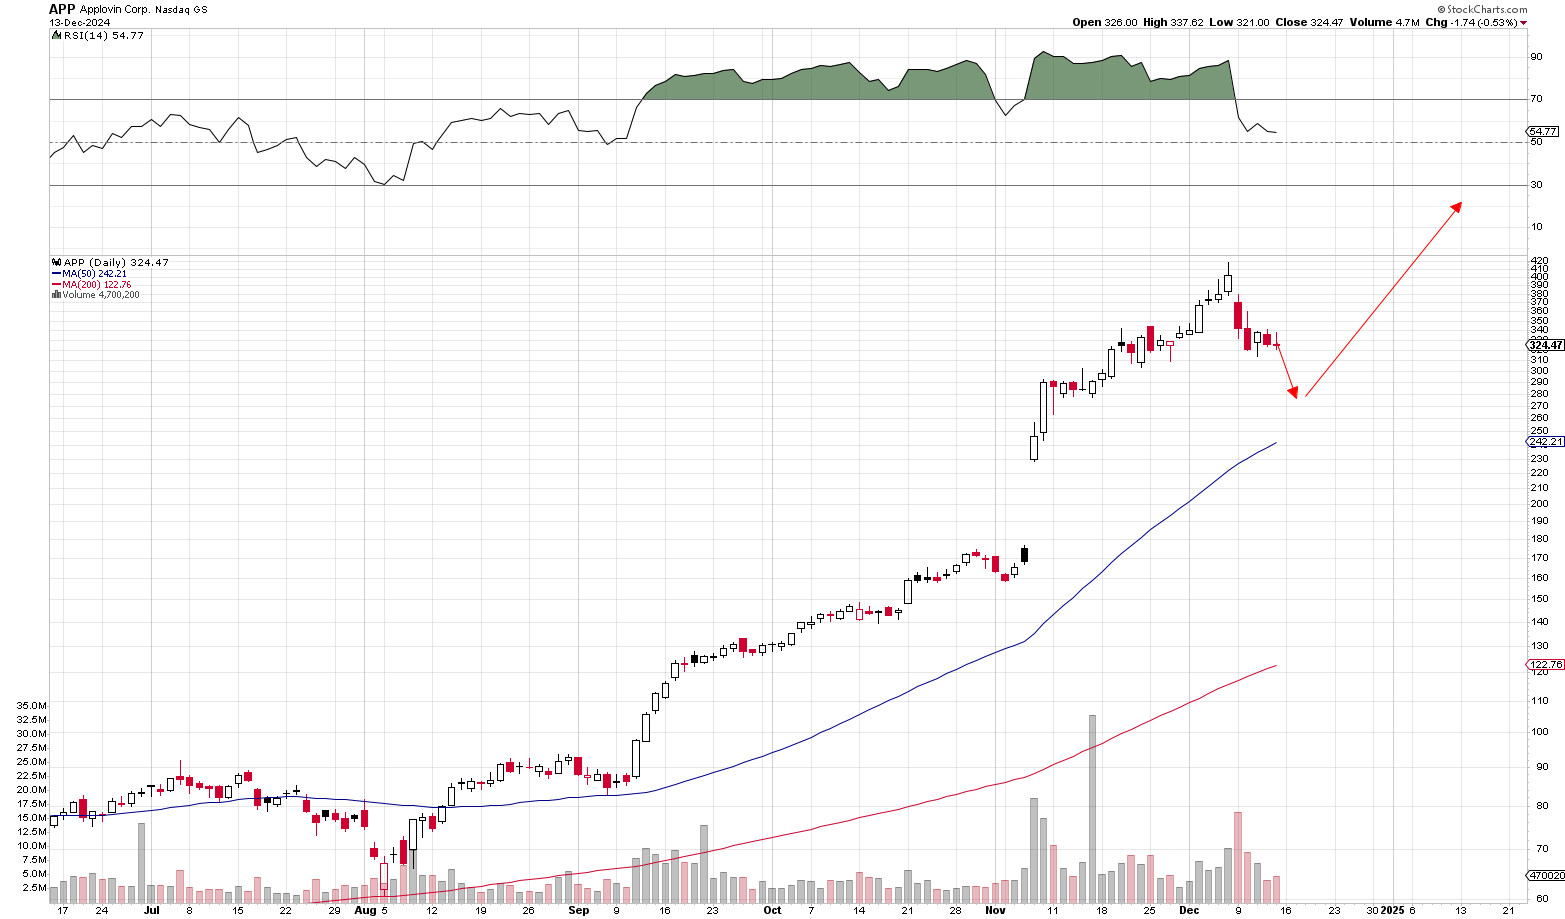
Applovin specializes in mobile app technology, providing developers with tools to monetize and grow their applications. The company’s robust platform and strategic partnerships have positioned it well within the rapidly expanding mobile app ecosystem.
After the NASDAQ-100 (QQQ) pull-back ends, Applovin should make for a good long trade. From am momentum perspective, it should go back up to $420 a share which is a full 30% from current levels. That strong momentum doesn’t happen in isolation. This pull-back should be bought up.
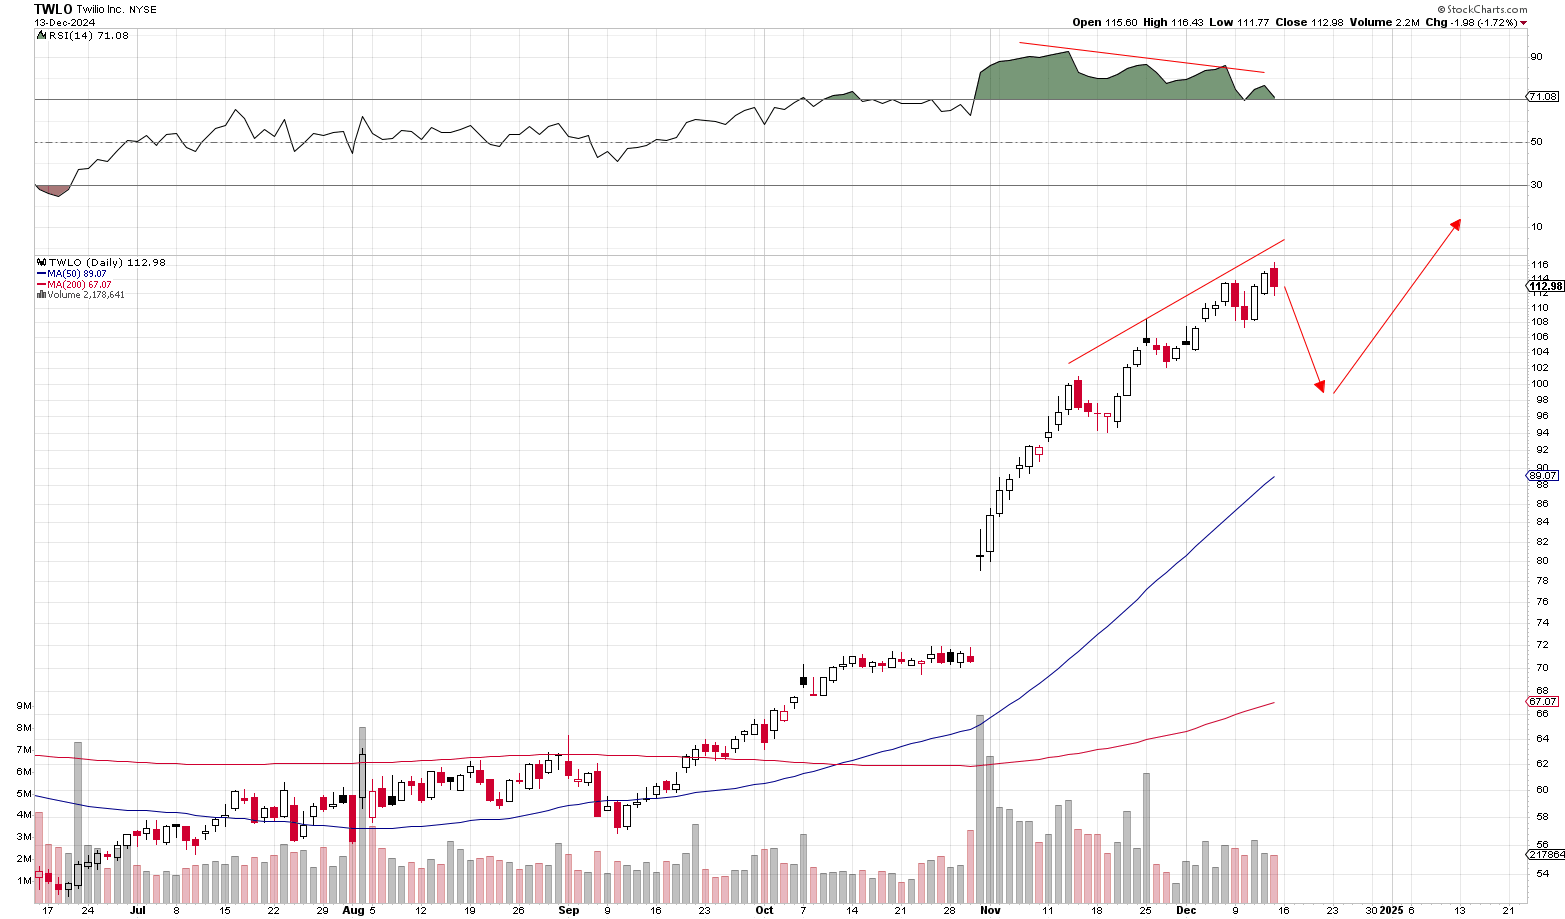
Twilio offers cloud communications platforms that enable developers to integrate messaging, voice, and video capabilities into applications. With the increasing demand for digital communication solutions, Twilio’s services are integral to numerous businesses seeking to enhance customer engagement. We use Twilio here at Sam Weiss.
The stock has crazy strong momentum behind it rallying a full 60% in the last 6-weeks. But we’re starting to see some negative divergence forming. With the QQQ set to pull-back 3-4%, we should see some pressure in Twilio opening up an a near-term opportunity to trade the retest of the highs.
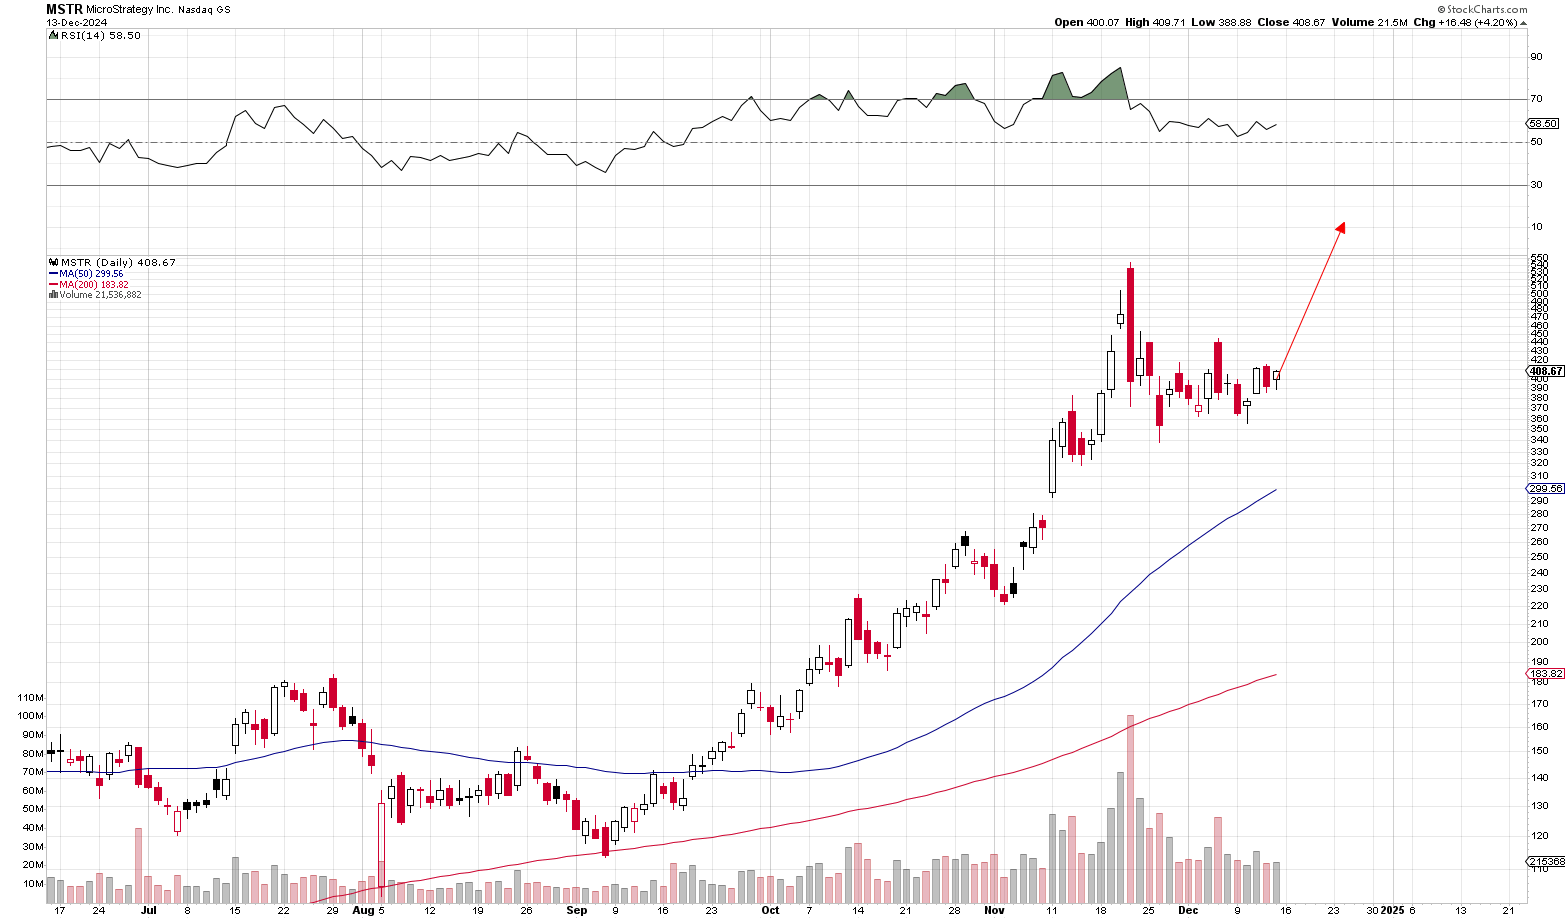
MicroStrategy Inc (MSTR) is a leading enterprise analytics and mobility software provider. Notably, the company has also made significant investments in Bitcoin, adding a unique dimension to its financial profile. The stock has been consolidating for the last five weeks and is likely to see another leg higher after the QQQ pull-back ends.
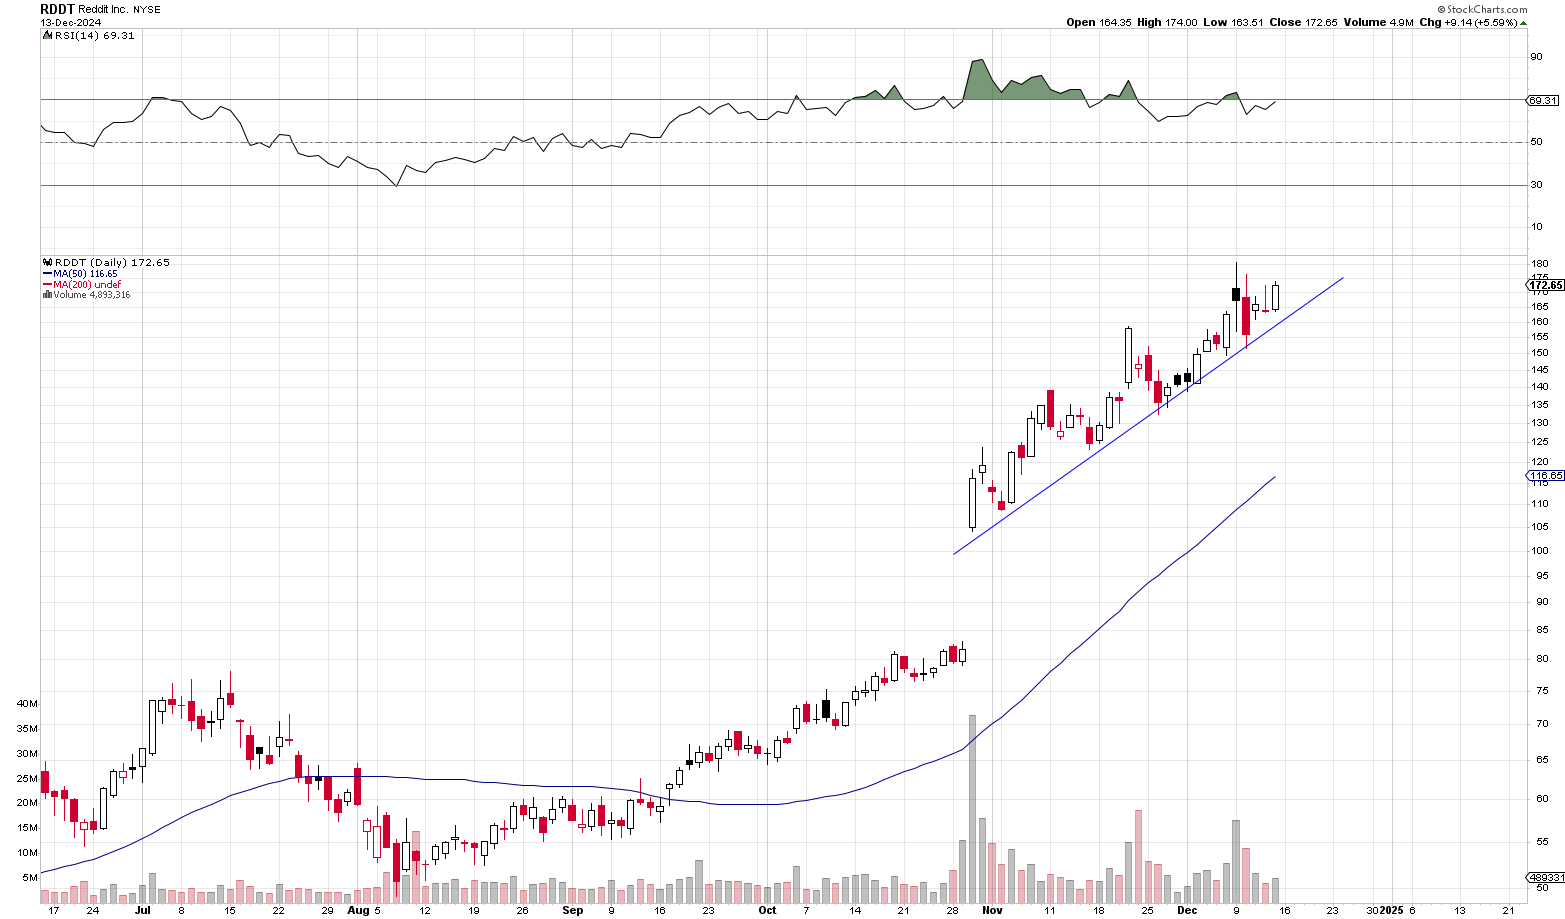
Reddit is a popular social media platform known for its diverse user-generated content and active communities. Since its IPO in March, Reddit’s stock has more than tripled, reflecting strong earnings and an optimistic outlook driven by substantial digital advertising revenue and AI content licensing deals.
The stock has been on a non-stop tear since reporting 70% revenue growth on October 29. It has formed a nice clear-cut lower trend line it momentum continues to expand. We’ll see how it behaves on the next broad market pull-back.
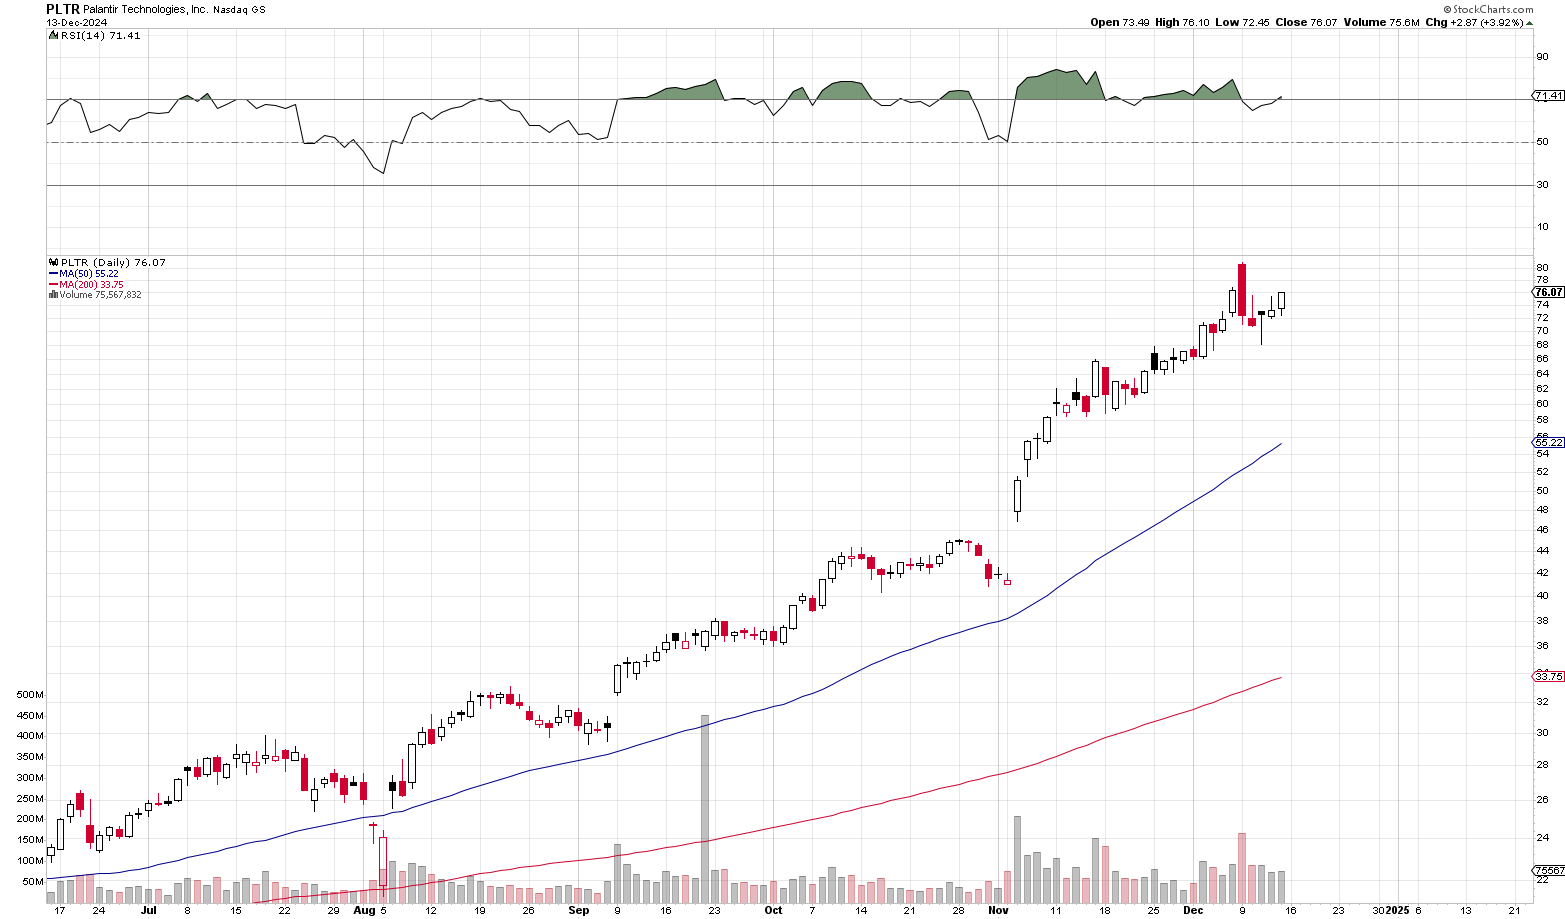
Palantir Technologies Inc (PLTR) specializes in data integration and analysis software, serving both government agencies and commercial clients. The company’s recent inclusion in the NASDAQ-100 Index and its expanding AI product offerings have contributed to substantial stock gains.
The stock has nearly doubled in value since the company reported earnings in November with the CEO saying, ““We absolutely eviscerated this quarter, driven by unrelenting AI demand that won’t slow down.” I guess he missed the class about using conservative language when describing the company’s financial forecasting lol. But the company has been on a tear and management continues to revise its full-year revenue outlook upward each quarter. They know how to drive interest in the stock.
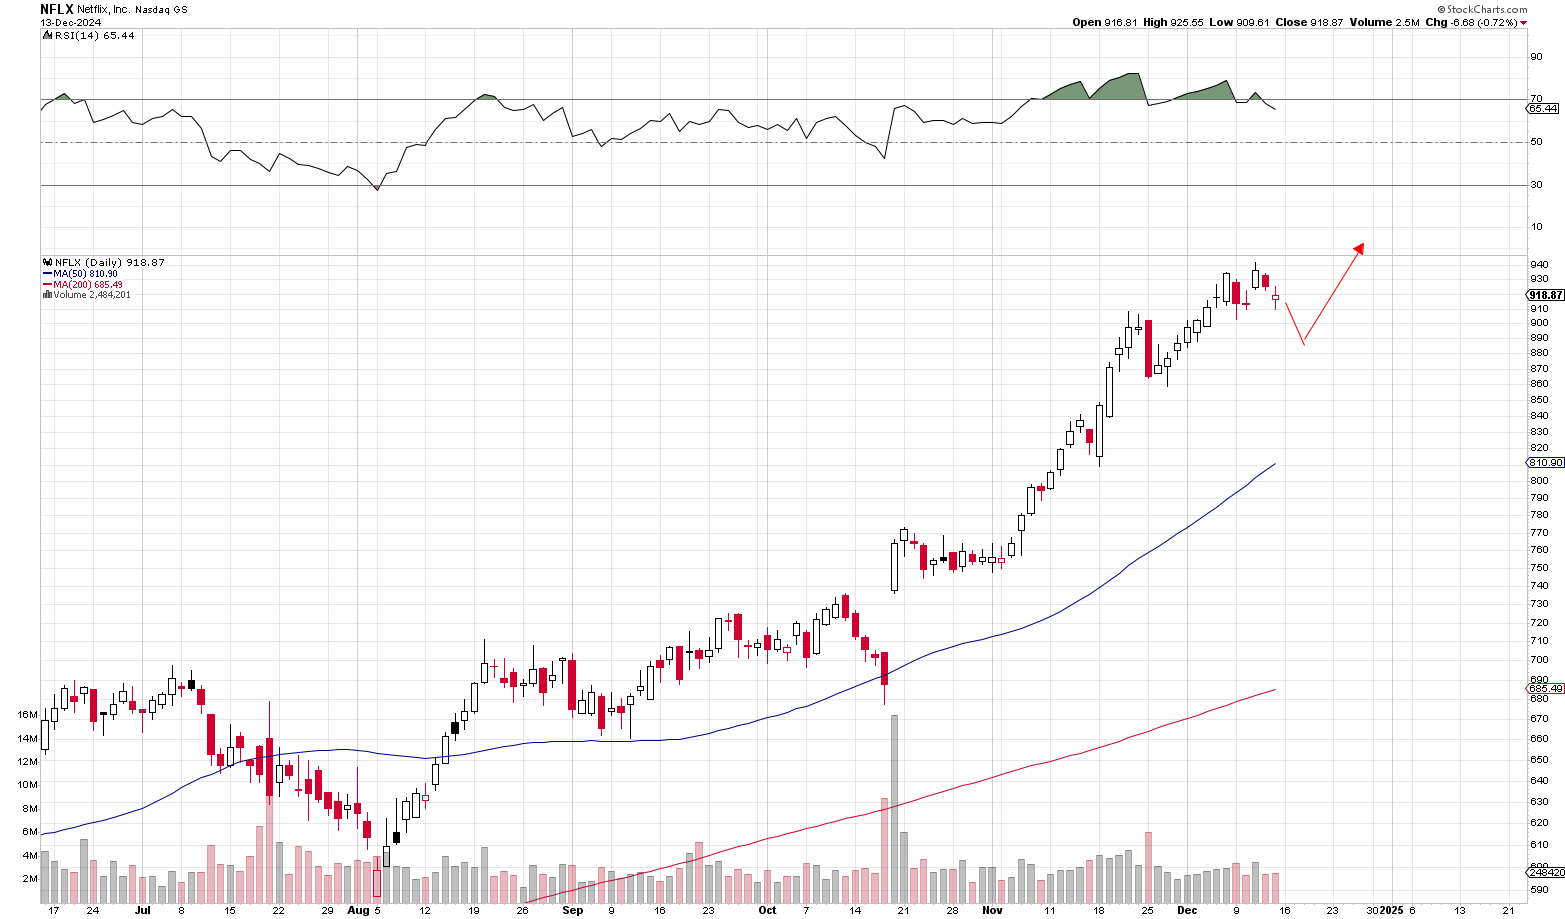
Netflix Inc (NFLX): Exploded higher on its massive earnings beat in mid-October reporting 45% EPS growth exceeding Wall Street expectations. That’s with a $91M F/X loss. The stock is up nearly 50% since it reporting earnings.
With the stock looking to test the $1,000 level, we could see a big surge on a breakout similar to what we saw with Tesla when it busted through $1000 and Nvidia when it broke through $1,000 last year. If we get a big enough pull-back on this market sell-off, it may open up a big opportunity to trade the $1000 test/breakout run. It will test $1,000 now that it came within striking distance of the number.

Would you consider taking a short position if the QQQ rallies to $535 this week?
We talked about that a bit on Friday. We may do that in the Baratheon portfolio. But we’d need to see extremely overbought conditions again like we saw ahead of the pull-back from $527 down to $519. At an 80-RSI there’d be a high likelihood for an initial $5-$7 pull-back before we get a larger roll-over.
We’ll have to see how it trades in the next few days. Obviously, the other portfolio are all long-only portfolios and we never short in those models and for good reason.
In all honesty, in most cases, the market should be traded from the long side. There are only very very limited circumstances where a short-trade develops and even then the risk is way high.
Does NVDA show weakness relative to the QQQ? QQQ at ATH while NVDA starting to emerge a downtrend when breaking the equal lows of ~132. Any thoughts on the matter?
NVDA has decoupled from the QQQ along with the Dow which is now on its 8th consecutive down day. That’s totally fine. It’s only a short-term issue and likely due to capital rotation from momentum traders.
It does indicate that when the NASDAQ does have a correction Nvidia is likely to perform better than it otherwise would if it was running with the market right now.
Does the Santa rally change the outlook? Historically December has seen gains, so doesn’t it seem odd to have a 3-4% drop?
Yes, very possible. All we could derive from the data above is that the QQQ tends to peak at 8 to 10% and usually within 15-20 trading days.
The largest outlier is 25 sessions. Could we see a single sample size go to 30 sessions? Sure why not.
All this analysis does for us is tell us that there’s high risk once the market runs 8 to 10% and north of 20 sessions.
That’s why we have the 1 to 10 session forecast. If the QQQ runs for another 10 sessions then we get to 30. Which makes this an outlier.
But it also tells us that at that point the risk is very high or a pull back and it also becomes very high for a correction.
————
Now it is really important to realize that this current rally that started in September is actually very lackluster. The QQQ right now is just barely catching up to the size of the previous rallies.
If you look at the intermediate term table in analysis above, we had rallies that went for 30% 36% 25% all in the last few years.
Heading into today’s session, we were still under 20%. So on an intermediate term basis, it’s catching up.
Also, when we look at the segmented rallies in this overall intermediate term move up, they too were below average. Even now with a QQQ at $537, it’s only at 8.5%. Go look at the rallies from earlier in the year and we have 10% 11% rallies. Someone went to 12%.
It used to be that we would start to raise red flags at 50 points This segment is not even at 50 yet.
We only adjusted our analysis because the QQQ started having progressively smaller segments. What we’re seeing now is a typical segment.
Chances are the QQQ comes up against resistance at $540 which would actually put the rally at only $45.
What is different about this rally is that it has gone on for 20 days and that is because it started fairly weak. So it has kind of grind on in terms of sessions, but in terms of percentage points it’s barely catching up to the averages.
Is it possible that the FOMC meeting on Wednesday is actually a positive catalyst for the market rather than a negative one as you predict?
So I wouldn’t say that the FOMC would be a negative catalyst in any real fundamental sense. I just can see the market using isolated statements from the fed as a short-term reason to sell-off and take profits.
Most likely anything that comes out of the fed is going to have a short-term impact. Positive or negative, unless the Fed does or says something entirely unexpected, the impact will be short-lived.
What isn’t going to change is that the market overall is due for a pullback. From a time perspective, the rally is now 21 days. From a gain perspective, we’re at 8.8%. Those two numbers put a cap on how far the market can go from here before it pulls back.
So even if it were to go up on the fed, there’s not a tremendous amount of upside left in the market.
Here’s how we use that data. We use this information in order to put on hedges on portfolios that are still not hedged. We use it to sell covered calls. And we use it as a guide on when it makes sense to put on near term long trades.
For example, we wanna buy positions in the Baratheon portfolio, but we are pausing on doing so because of the concern that the market is going to drop a few percentage points. Once that pull back is out of the way there is lower risk in the market.
We could ride momentum trades at that point. We also need to be cognizant about the fact that the overall intermediate term rally may soon be coming to an end. Whether that happens here or at the start of the new year or near the end of January, the overall intermediate term rally that began in September is coming to an end as well.
We are due for a larger pull back. The way we’re gonna use that information is to put on larger hedges and more aggressive covered call selling.
We are also going to launch two new portfolios that will be in cash right now. Because what we plan to do is purchase the hedges for that portfolio ahead of time before the correction happens. .
So we might buy 5% puts in the portfolio and remain 95% in cash.
Once the correction happens, we will have our hedges already in place and then we can go long.
We’re going to talk about that in tomorrow’s daily briefing
Closely watching this prediction. Good luck!