Two weeks ago, I published an article entitled “Charting the Course: Outlining the Near & Intermediate-Term Risks and Headwinds that like ahead.” Many of the risks and headwinds I outlined in that article ended up coming to fruition. Specifically, the risk that the NASDAQ-100 might sustain a double-correction. In the article, I wrote:
Somewhat related to the double-top set-up above is the risk that the market might sustain a double-correction. What is a double-correction? It’s exactly what it sounds like. The market sustains an outsized correction of 16% like it has. It then rallies back to or close to the highs, and then sustains another correction of similar size or smaller.
These things typically happen when the markets enters a period of uncertainty like we saw between July and November 2023 of last year. For five months the market trended down having three sharp sell-offs followed by two sharp rallies of 8-9% each. The selling was more shallow than this recent correction, but the period of uncertainty lasted for a good long while.
When we published the article, our general expectation was that the NASDAQ-100 (QQQ) would sustain a small near-term pull-back of 2-4% over a period of 5-7 trading sessions and then resume the rally it began on August 5. We had SEVERAL good reasons for expecting as such and they were:
(1) the NASDAQ-100 had rallied $62 (14%) straight up from its August 5th lows without a 2% pull-back. This marked the single biggest leg up the QQQ had ever sustained in at least 5-years without a 2% pullback. In a normal rally, the QQQ usually goes up no more than 35-50 points (7-11%) before it sustaining a 2-4% pull-back.
(2) What’s more, such a large sized-leg up in the market almost always precedes another a second or third leg. It’s rare to see a single-legged rally when the QQQ has such incredibly strong momentum behind it. For the QQQ to rebound $62 without another hard leg up is a big exception to broad momentum rules.
(3) The market is always higher at the 35-day mark post-correction than it is at the 20-25 day trading mark. There aren’t many instances where that isn’t the case. In rare exception do we see the market lower at the 35-day market than it is at the 25-day point post correction.
(4) Most rallies last 40-70 trading days on average and this one was only at 14-days making it the 2nd shortest rally in 15-years;
(5) there were several potential positive catalysts on the horizon including Nvidia’s earnings, inflation (this week) and the fed cutting interest rates; and
(6) Most importantly, double-corrections are exceedingly rare. They do happen once every 5- years or so, but in most cases, when the market bottoms, it bottoms until the next correction.
That being said, we anticipated that the market carried a higher-than-normal risk of experiencing a double-correction in this particular case, and our investment strategy is and was designed to mitigate those risks. A sound investment strategy must account for both known and unknown risks, and it is precisely these uncertainties that we hedge against to ensure success. It is also why the 2-year rule is a cornerstone of our core investment principles. The two most critical principles to successful investing are (1) investing on a 2-year minimum time horizon and (2) buying on corrections to gain better entries and to reduce risk. The importance of those rules are clearly illustrates in Chapter 1 of our Core Investment Principles.
At the close of trade on Friday, the NASDAQ-100 is now down 10.89% from its all-time highs and down 7.7% from its recent highs of $485.50 set 11-trading day ago. That puts the NASDAQ-100, and many of the stocks making up the index, at a buying opportunity (based on our strategy). Nvidia (NVDA) is down a whopping 27% from its all-time highs.
Based on our investment strategy, we bought Nvidia (NVDA) common stock and December 2026 DITM leaps last week at $104 and again at $101.40. For us, Nvidia (NVDA) being down nearly 30% from its all-time highs makes it a clear-cut buying opportunity. The company issuing a $50 billion buy back should tell you everything you need to know about the company’s own confidence in its future. We like Nvidia (NVDA) at $100 and our strategy will capitalize on the stock rallying 50%+ from its current levels. By the time we get Nvidia’s first earnings report of 2025, we expect the stock to be trading near the $150 level again.
With that in mind, we’re also invested in such a way as to hedge out market related risks and uncertainties. If the market were to slide into a full-blown bear market today, we’d weather that storm well and come out the other side with profits. And that’s how investors should always be invested. Ready to take on exogenous events.
In the sections below, we’ll outline our expectations and where we believe the market is likely headed in the near, intermediate and long-term.
NASDAQ-100: full Double-correction underway
With the NASDAQ-100 down 7.7% from its $485.54 highs set on August 22, 2024, there’s no question that a double-correction is now underway. In fact, that already puts this correction at the same level as the April 2024 correction (8%) and puts it ahead of at least 8 other corrections going back to 2010. What’s more, last week’s sell-off amounted to one of the largest weekly pull-backs of the entire bull market that began in December 2022.
So obviously the question we’re going to want to answer is: how much further does this correction have to go and where are we likely to bottom?
We’ll begin to answer this question by taking a look at the near-term outlook. The near-term will give us a small window into where the markets are likely headed this week going into Apple’s iPhone announcement and the CPI report (Wednesday).
NASDAQ-100 (QQQ), S&P 500 (SPY) & Nvidia (NVDA) are all Oversold & Ready to Bounce
Both the QQQ and NVDA have reached extremely oversold conditions on the hourly chart and are now likely to bounce early this week. As we’ve mentioned a few times before, while overbought conditions (RSI>70) has very little in the way of predictive value, oversold conditions is a different story. Anytime we get oversold markets (QQQ/SPY/DIA), there’s high probability for a near-term bounce at a minimum.
A back-test of ANY period in the market’s history bears this out quite clearly. There’s no question that deeply oversold conditions on the hourly chart preceded a big bounce in the market in the overwhelming majority of cases in the historical record. That’s one indicator that is independently very reliable. The NASDAQ-100 finally reached oversold conditions on Friday and is likely due to bounce on Monday or Tuesday of this week. With CPI due out on Wednesday before the open, I expect we’ll see the market up big on either Monday or Tuesday of this week.
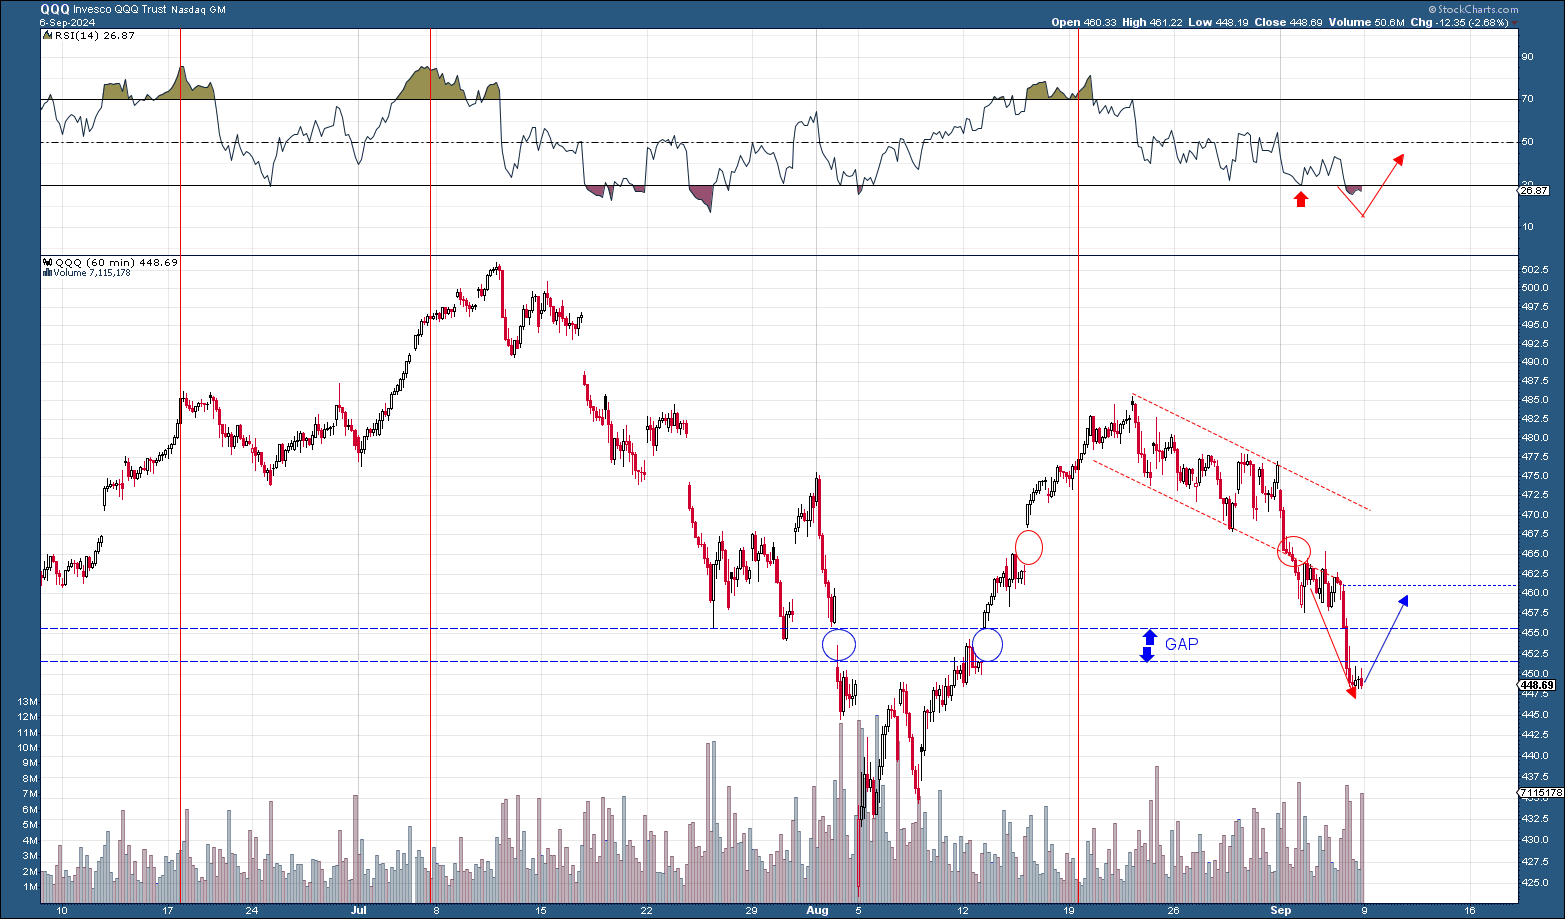
For the near-term, I expect we’ll see a rebound that takes the NASDAQ-100 up to somewhere around the high $450’s. After that, we go into more intermediate-term territory and we’ll discuss that below.
Now it’s important to point out that with the QQQ is just barely into the mid-20’s on the RSI and can go a little lower as we saw during the August 5 correction. We don’t often see the NASDAQ-100 get as oversold as it did near the end of July, but it does happen from time to time and it’s important to keep perspective here.
The QQQ is in the middle of a double correction and it shouldn’t be unexpected or surprising to see the NASDAQ-100 reach deeply oversold conditions before bouncing. So if we get a hard push down early this week ahead of the bounce, it shouldn’t be in any way surprising and your investment strategy should take that into consideration. We’re due for a bounce, but we could easily see another hard push down before we get one.
In fact, take a look at this chart below. What you’ll find is that the NASDAQ-100 has only reached such oversold conditions 7 times in the past 12-months. And in 6 of those cases, the QQQ either fully bottomed or bottomed ahead of a strong rebound. The one time it didn’t was when it reached oversold conditions near its highs. That is the one time this past year we didn’t see the QQQ rebound hard off of oversold conditions. See here:

Nvidia (NVDA) is due for a monster rebound
As we mentioned last week, Nvidia (NVDA) has already seen multiple instances of oversold conditions last week, it’s off 23% from its $130 highs a few weeks back and at a ripe buying opportunity. Whether that bounce continues on or whether Nvidia sees another leg down will largely depend on the market’s intermediate-term direction. But for the near-term, it’s due for a bounce.
I do think it’s very important for Nvidia (NVDA) investors to understand that the recent bearish activity in the stock has NOTHING to do with Nvidia (NVDA) at all. I’ve seen a lot of investors get hyper focused on the Bloomberg article, what Bloomberg did wrong, the subpoena, the DOJ investigation and other FUD-related matters. I’ll just come out and say it right now, that’s all a distraction. It’s bullshit. None of that nonsense has any connection to why Nvidia is pushing lower right now. Nvidia is lower right now due to broad market pressures and that’s it.
Don’t believe me? Wait until the stock market starts to rally after this correction is over and we’ll see how much the DOJ investigation will drag on Nvidia as it rallies to $150. It won’t even be a speed bump.
If the NASDAQ-100 were rallying right now, Nvidia, Broadcom and every other stock that got smacked on earnings would also be rallying right now. Nvidia, like every other stock that trades on the NASDAQ or NYSE, does not trade in a vacuum. All stocks are subject to the broad market pressures, trends and volatility. If the stock market were to enter a bear market right now, Nvidia would trade substantially lower and there’s nothing Nvidia (NVDA) can do about it. Nvidia’s earnings could be flawless. Its news could be flawless. And yet the stock would take a huge thumping. That is because when there’s a fight to safety, a flight to quality or cash raising, there is a coinciding broad-based reduction of risk (“risk off”) that takes place in the market and it impacts all stocks. Everything in the stock market becomes devalued in a risk off environment. During broad-market rallies, the exact opposite happens. Everything gains added “risk-on” premium in bull markets. What we’re seeing right now in Nvidia (NVDA) is a risk-off, run-of-the-mill market correction and it’s impacting virtually all stocks in the market.
But soon enough, the correction will end, the market will bottom and we’ll be off to the races again. And here’s exactly what we need to look for as an indication that this is about to happen.
When will the correction end?
In virtually every correction, there are a few things we want to see happen before we can be confident in forecasting that a bottom is in. Now it’s important to understand that the market can bottom at any time. None of these things have to happen for a bottom and we can see the market bottom literally at any moment. It’s just that when these indicators do occur, there’s a very high probability a bottom is in.
(1) August 5 Rebound Already Set the Lows
The first one already triggered when the S&P 500, NASDAQ-100 and Dow all rallied either right up to or near their all-time highs after bottoming on August 5. We discussed this a bit in Charting the Course. Whenever the market sustains a correction and then rebounds for more than 50% of the size of the sell-off, it is highly likely that the lows are in. Now while the market might make incremental or slightly new lows in this sell-off, it is unlikely that we’re going to see substantial new lows below the August 5 lows. Chances are we see a bottom that is ABOVE the August 5 lows.
The only thing that could derail this thesis would be if the economy made a huge shift to the negative. We ‘d need to see a serious recession, serious job losses or a serious resurgence in inflation for us to see a double-top scenario play-out in the markets. Basically, a full-blown bear market would have to develop for the S&P 500 to experience a double-top breakdown or substantial new lows below the previous lows. And the economic data we’ve seen so far doesn’t indicate we’re anywhere near that.
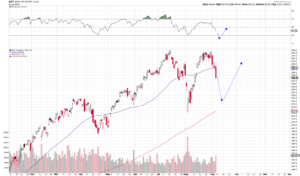
The post-correction rebound very often telegraphs the likely path ahead. As the NASDAQ-100 and S&P 500 both rebounded beyond the 50% retracement line, the lows are already in. This correction will likely bottom either just above or just below the previous August 5th lows. See below:

(2) The 200-Day Moving Average
In a normal correction, the 200-day moving average is very often a likely bottoming point for the indices. And in this particular correction, we’re unlikely to see the market trade much below the 200-day moving averages. The NASDAQ-100 might, but the SPY is not likely to see lows below that point. This is a minor indicator, but an inflection point worth mentioning, as the NASDAQ-100 isn’t far from its 200-day.
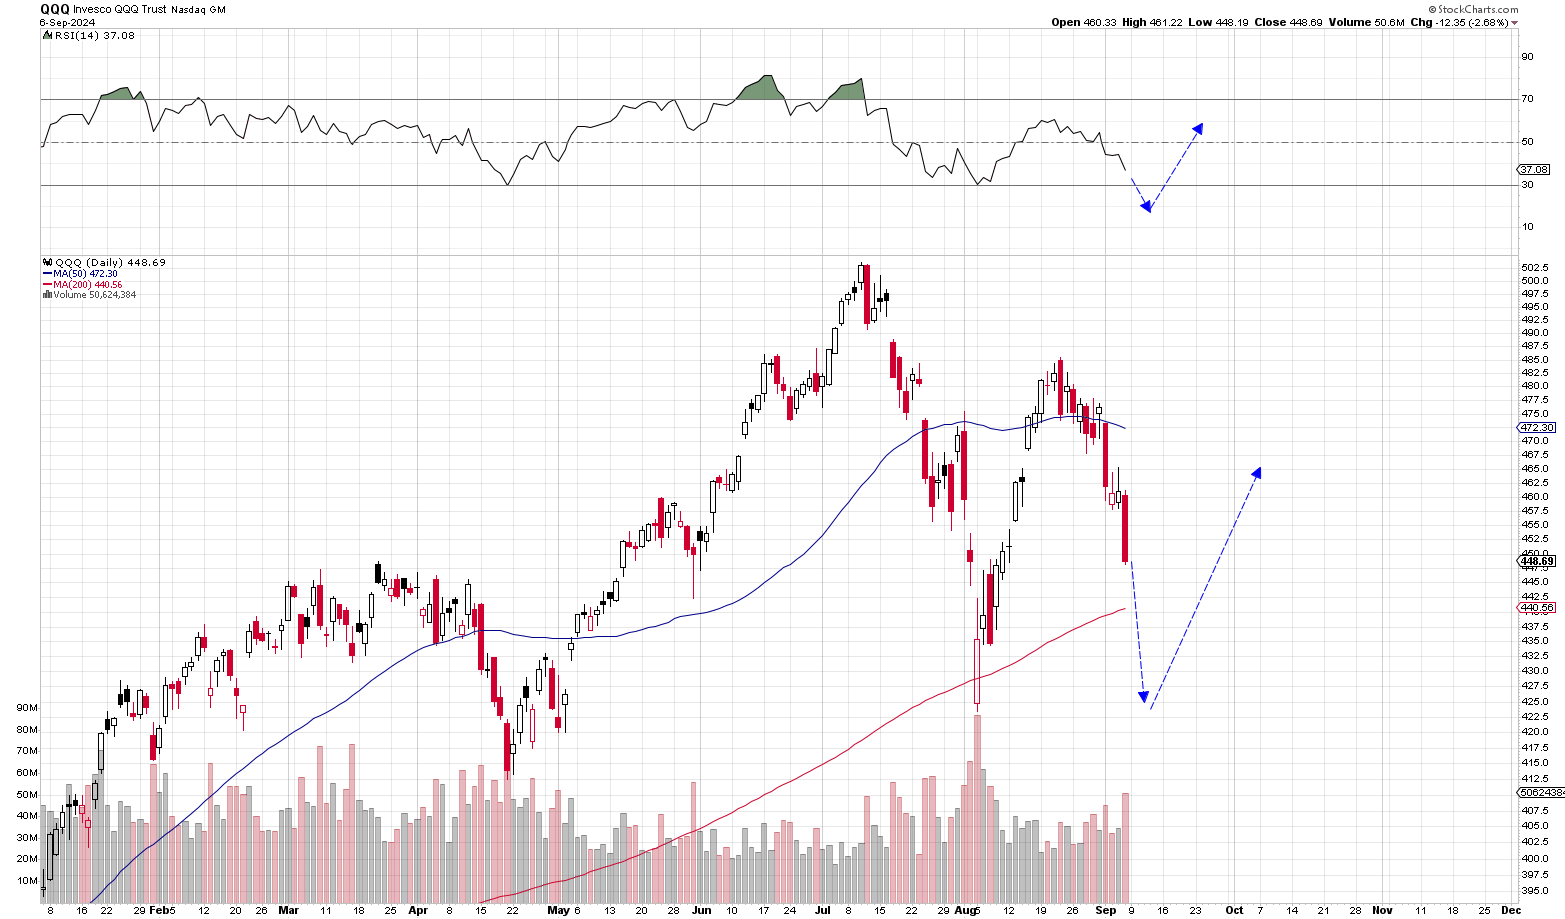
(3) 30-RSI on the Daily Chart
Probably the biggest indication you’ll ever get for a bottom in the market is oversold conditions on the daily. Just to illustrate how rare of an indicator this is, over the past 5-years, the SPY has reached oversold conditions only a handful of times and each time it happened it preceded a massive rally of 10%+. In fact, the SPY reached oversold only twice during the entire bear market in 2022. Once on the first huge leg down ahead of the 10% bounce and again when the bear market bottomed in October 2022. If we see oversold conditions on the daily chart, that’s a huge indicator for a low in the markets.

In the most brutal high volatility corrections, you might see the SPY or QQQ reach a 20-RSI on the daily chart. But when that happens, it ends up being one of the greatest buying opportunities of the era. I expect no different here. If we see the SPY or QQQ push down to a 20-RSI, it’s likely one of the better buying opportunities of the bull market.
The NASDAQ-100 is at a 37-RSI, so just a bit more oversold than the SPY, but not quite oversold on the daily yet. Now as I mentioned above. The markets need not reach oversold conditions to bottom. It’s just that if the indices do reach oversold conditions, then they’ve likely bottomed. Oversold is a sufficient but not a necessary condition to bottom.
(4) Overbought $VIX
Another big indicator for a bottom is an overbought $VIX which often corresponds with oversold indices. Those things typically happen at the same. There aren’t many instances of the $VIX going overbought without a coinciding market bottom. The $VIX isn’t quite there yet. But it has pushed up to the 24-level which is at the high end of the range for the past 18-months.

(5) Oversold $NYMO (NYSE McClellan Oscillator)
One of the more rare, old, and well established indicators is the New York Stock Exchange McClellan Oscillator which has a very high backtest for forecasting lows. The problem is that it rarely triggers. You typically need pretty bearish setniment to see the $NYMO push oversold. But when it happens, it’s reliable.
We’ve only seen the $NYMO reach -100 oversold five times since the start of the 2022 bear market and it went 5-for-5 since then. Go back 15-years and it’s at 90%+ reliable. The last time we saw it get down to -100 was in April. It pushed down to oversold -80 in August at the lows. So that’s something we’re going to want to watch along with the $VIX and RSI as we head into the Fed.

Again, these are just indicators that have a high reliability in forecasting a bottom in corrections. They’re all sufficient conditions. Not necessary conditions. The market could have already bottomed on Friday and that would make total sense under the totality of the circumstances.
what about nvidia (NVDA)?
Here’s how all of this impacts Nvidia (NVDA) and where the stock is likely headed from here. To begin with, Nvidia (NVDA), like every other stock in the NASDAQ-100, is going nowhere until the market bottoms. Once the QQQ bottoms and we begin a new rally, then NVDA will spread its wings and fly again.
That being said, with the NASDAQ-100 in uncertain territory (at least until it reaches oversold conditions on the daily), investors need to be prepared to see Nvidia (NVDA) test its August 5 lows. Even though Nvidia (NVDA) is oversold on the hourly and due to see a huge rebound near-term, it can easily peak at $110-$115 and then see another hard leg down with the markets. In fact, Nvidia (NVDA) is at the same exact daily RSI as the NASDAQ-100 on the daily chart, and like the NASDAQ-100, there’s a ways to go before it reaches a 30-RSI on the daily.
Still, it’s important to remember that NVDA is one of the most fundamentally sound companies on the NASDAQ-100 and that this is all temporary market related volatility. At $100 a share, NVDA isn’t far from its eventual lows. Whether the market bottoms this week with inflation or after the fed on the ensuing week shouldn’t haven any bearing on anyone’s investment strategy. Not if you take a long-term approach to investing as every good investor ought to do. Anything short of that is straight up gambling.
Nvidia is likely bottoming between $90 and $100 a share again. It may temporarily see sub-$90 under extreme conditions, but even so, the stock market really isn’t all that far from a bottom, and once we get rallying again, Nvidia moves back up toward its $135-$140 range
This brings me to my next point. Here’s why it’s critically important to always maintain a long-term time horizon when investing. Nvidia’s stock price has largely now caught up with its earnings growth. This is not to say that the stock can’t move substantially higher. Of course it can and it will. But what that does mean is that we’re unlikely to see the same types of stock gains that NVDA saw this past year and we’re probably going to see periods of consolidation more often now.
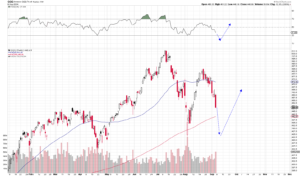
In fact, like many companies of NVDA’s size and scope, there’s a tendency for the stock to go through consolidation phases to allow the P/E ratio to shrink a bit. Nvida (NVDA) already went through one such phase when it traded between $40-50 for nearly 6-months in 2023. I believe Nvidia (NVDA) has entered a second such phase and will probably trade between $90 and $150 for a while now. Take a look at this NVDA weekly chart below. Notice the consolidation period between June 2023 and January 2024. Compare that period to today. Though the scope is greater today, the periods are very similar and occur during similar periods, seasonally.

Apple, Inflation & the Fed
In spite of the technical picture laid out above, there is a very strong possibility that the markets may have already bottomed on Friday or will soon be bottoming within the next 7-8 trading days. First, we have Apple introducing its new Ai-powered iPhone. As anyone who uses ChatGBT for research and development can tell you, an OpenAI powered iPhone can be a game changer. Depending on how that event goes, it could spur a rally in the market that takes us to the CPI report. When you consider the fact that we’re already due for a near-term rally as per the hourly chart, the likelihood for an Apple-lead NASDAQ-100 rally is looking decently strong.
On top of that, if we get a good CPI report, that could really shift sentiment to the bullish side again especially if the market begins to believe in an accelerated Fed timetable. But even setting that aside, the Fed lowering interest rates and the coinciding Q&A with Fed Chief Jerome Powell can easily trigger a market bottom as well.
In fact, the fed’s decision on interest rates has historically marked a turning point in the markets. It is often a trend changer. The fed day has marketed tops and bottoms in a large number of occasions. The fact that we’ve seen a double-correction going into a full fed pivot tells me we could easily see a bottom that day.
Even setting aside Apple, inflation data and the fed, the time-table for this correction is already nearing its mid-to-end point. The typical correction lasts roughly 20-days and goes for about 10-12% on average. We’re already at day 11 of this double-correction and down 7.8% on the QQQ. By the time we reach fed day, the correction will reach day 19. The table below shows every single rally and correction going back to 2010 in sequence:

What’s more, if you look at the current sell-off as one big correction with two major legs, this corrective period has now lasted 43 days. Looking at it that way, this correction would already be in the top 7 in terms of duration. Last year’s July – November correction lasted 71-days during which the NASDAQ-100 had three separate legs down of 8-9% with two significant rebounds of roughly 7-8% each. We have something similar going on here but on a much larger scale.
More importantly, if you look at the “correction duration” column in the table above, what you’ll find is that most corrections fall within a period of 10-20 days. Of the 34 past corrections going back to 2010, 23 had durations of 23 days or less. We’re already at day 11 and Fed day marks day 19. This tells me that we’re likely seeing a bottom in the market at some point before the end of September.
What’s more, even in those longer-duration corrections highlighted in yellow on the table, the market generally saw big rebounds of 8% or greater. So even if the correction were to continue into the month of October, we’d likely see substantial rebounds like the one we saw after the August 5th bottom anyhow.
Concluding Remarks
When looking at the totality of the circumstances, we’re probably not far from a bottom in term of both price and time. While technical indicators haven’t reached the extreme levels we might want to see to comfortably forecast a bottom in the market, there are a host of other catalysts which might indicate where we’re headed. For one, we are oversold near-term and due to bounce probably on the back of an Apple-lead rebound. How the market trades after that isn’t very clear. But what is clear is that the fed is the likely catalyst for a trend change.
Remember, as we noted above, the size of the recovery rally has largely dictated the likely lows ahead of time. Even if we sell-off on the Fed, we’re not likely to see the market go lower for much longer after that. Even if we bottom in October, price-wise we’d still likely be within a short trading range of the prior August 5 lows.
As our investment strategy is concerned, we’re long the NASDAQ-100 and Nvidia with both common stock and DITM Leaps. It doesn’t really matter to us whether Nvidia bottoms at $90 or $100. The end result is the same. Though we’d be happy to buy more at $90. Having a long-term time-horizon is everything. That can’t be overstate enough.

Will SW buy nvda if it hits low $90 ? if yes, common stock or LEAP?
We’re done buying common stock. We’d be adding to our Dec 2026 Leaps.