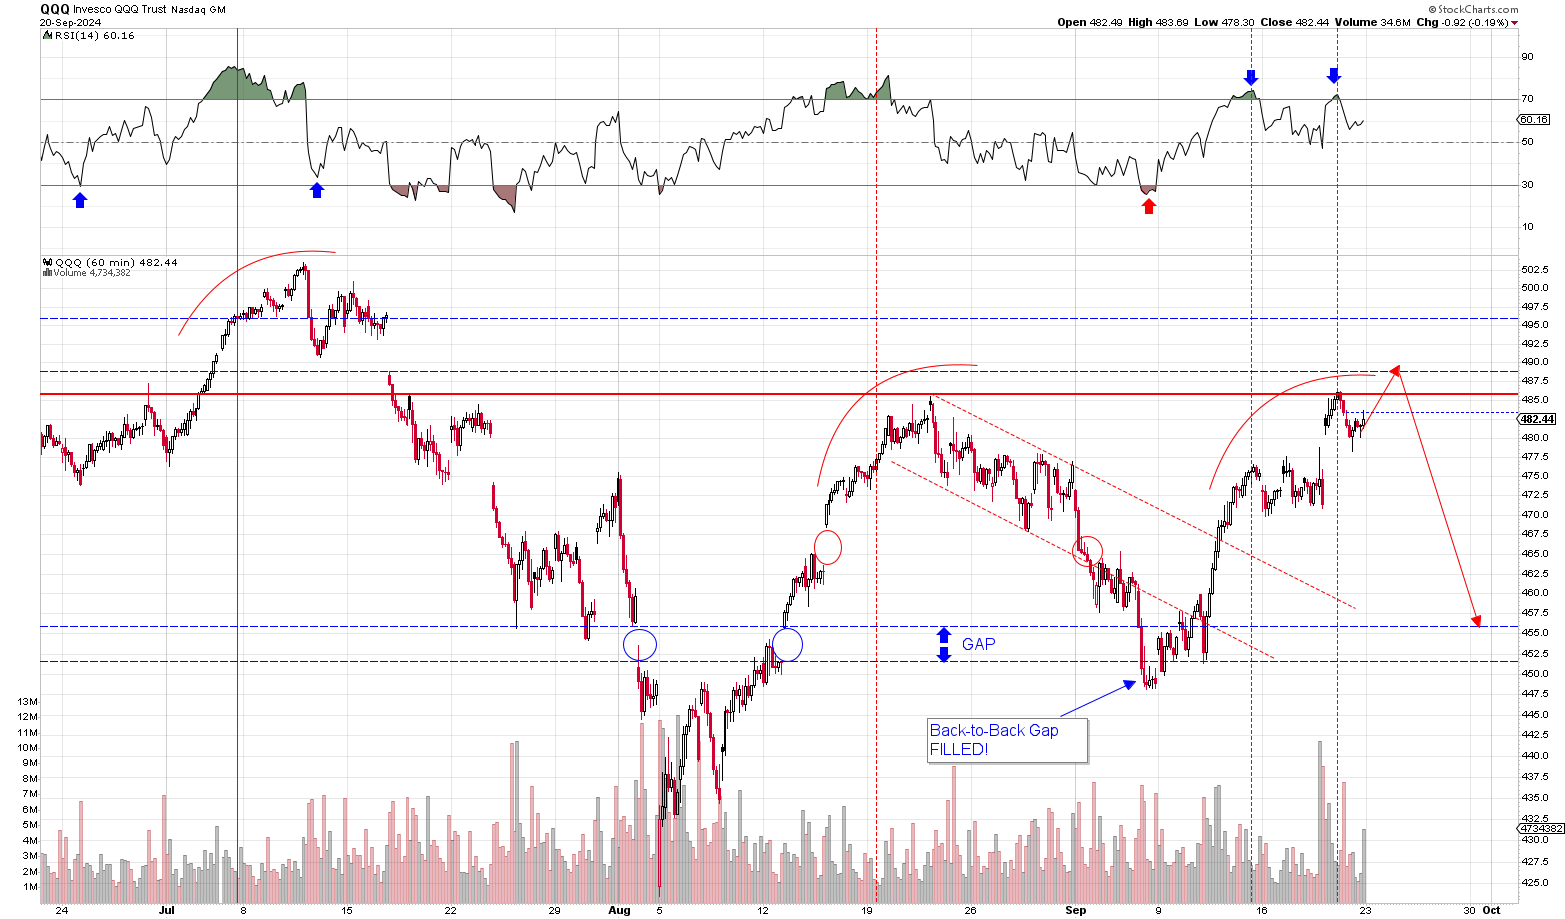
With Fed pivot now officially behind us and with interest rates going lower for the foreseeable future, the markets aren’t far from entering another big rally period that lasts at least 3-4 months. We’ve either already started that period with the September 6th lows or will enter a new leg of the bull market after one or two final pull-backs. That part won’t be clear until the SPY makes a decisive move higher at its all-time highs and/or until the NASDAQ-100 convincingly breaks out above $486 a share.
Now I’d like to be clear here. Our forecast is that the markets have either already begun a new leg higher or that it will soon begin a new leg that lasts several months. As our intermediate-term outlook is concerned, we believe the SPY will soon make a march to $600 and that the NASDAQ-100 will soon begin a leg up to at least $550; and we expect that to occur no later than late December to early January.
Sometime between now and October, the market will sustain one final sell-off and begin a new rally to all-time highs. As we mentioned all last week, there are a lot of good reasons to expect the markets to pull-back in the near-term (next 1-2 weeks) before embarking on the next leg higher. We’ll review the evidence in support of our near and intermediate-term outlook below.
Now it bears repeating that the broad market direction has a determinative impact on the direction of virtually all stocks that trade on any of the indices. As goes the NASDAQ, so goes Nvidia. I’ve had some people ask me what the NASDAQ-100 has to do with Nvidia. Everything. They go hand-in-hand. If the NASDAQ-100 falls 25%, Nvidia is going to drop 40% and vice-versa.
Near-Term Outlook: markets to top out fairly soon ahead of a typical 2-4% pull-back in the SPY & QQQ
As we’ve mentioned a few times now, there are two big NASDAQ-100 indicators that when taken together, offer a fairly reliable and consistent forecasting model for our near-term outlook.
(1) The Hourly RSI Indicator
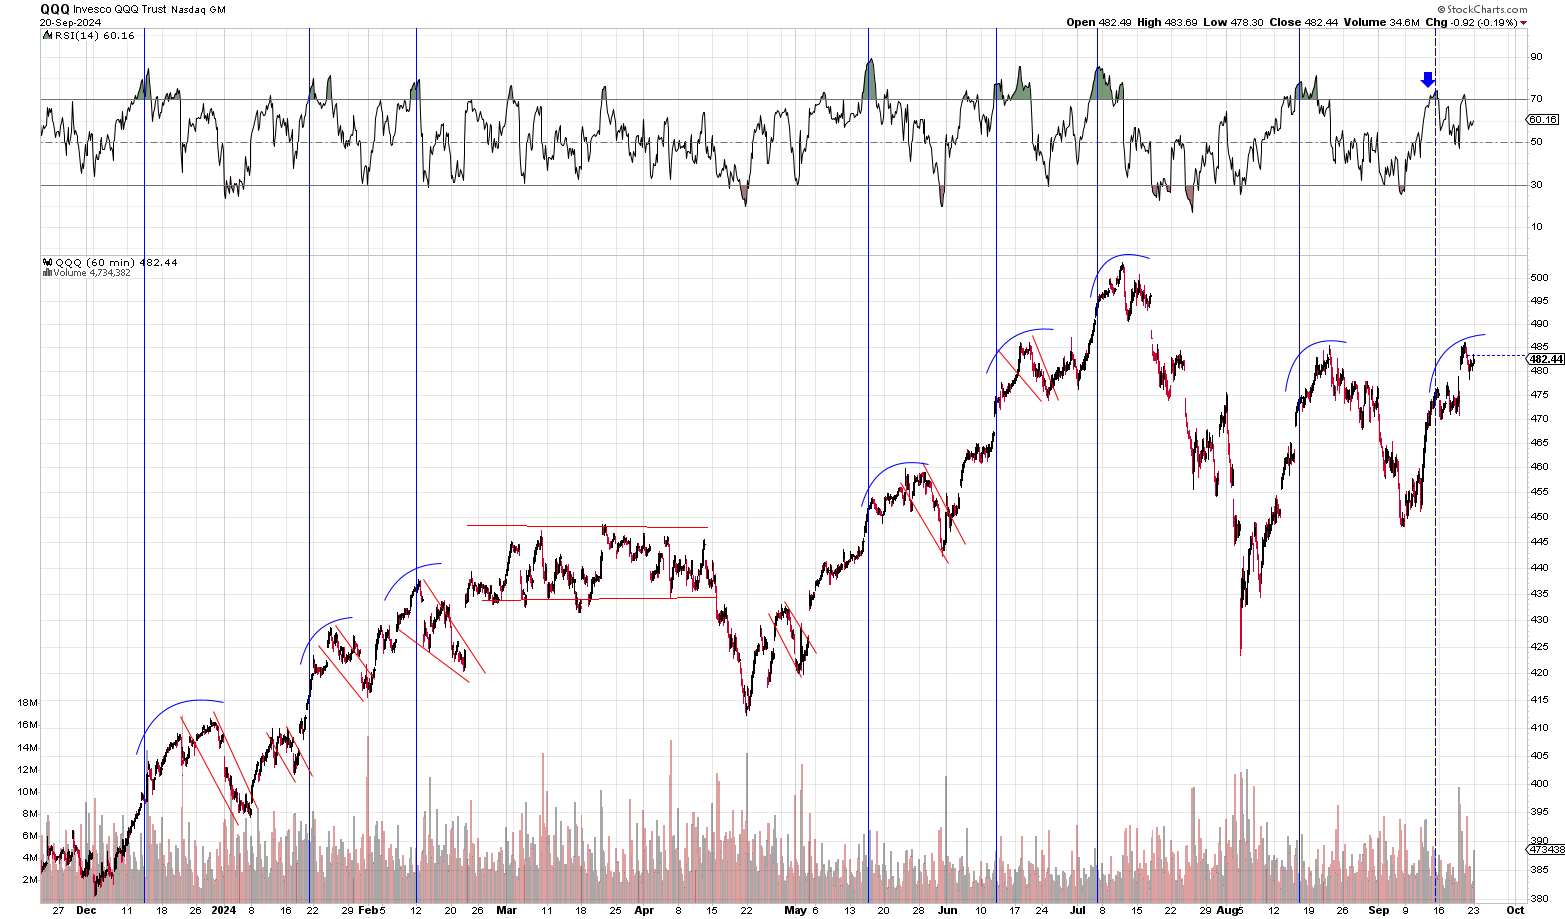
The first is the NASDAQ-100’s RSI indicator on the HOURLY time-frame. Whenever the NASDAQ-100 reaches peak overbought conditions on the hourly RSI, we generally begin to see a slowdown in the forward momentum — what we call the lag period — ahead of an ultimate top a few days to a week later. The lag period is pretty much required and almost always occurs ahead of a near-term top.
In fact, it is exceedingly rare for the NASDAQ-100 to immediately top upon reaching peak overbought conditions. Generally, the QQQ continue higher for a good $10-$20 (2-4%) and for another 3-8 sessions after reaching overbought territory before actually peaking. The best metaphor for understanding market momentum is that, like a speeding car, an overbought stock must slow down before it comes to a complete stop. The chart below quite clearly illustrates this concept and the lag period quite nicely. See the chart below :

Now the RSI by itself is largely meaningless. Especially if the NASDAQ-100 pushes into overbought territory fairly quickly after having reached a bottom in a correction. In fact, under those circumstances it is completely meaningless. It is only when you take the RSI indicator outlined above together within the context and size of the rally do we get any sort of forecasting reliability.
(2) Time-Price Cycle for the NASDAQ-100
Entirely independent from the hourly RSI on the NASDAQ-100 (QQQ), is the time-price cycle we’ve consistently seen since the December 2022 lows in the market. In fact, since bottoming out in December 2022, the NASDAQ-100 has rallied a total of 102% from a low of $250 to a high of $503.50. For the entire duration of that $250+ point rally, the NASDAQ-100 has gone on time-price-overbought cycles where it rallies $30-$50 before ultimately pulling back $10-$20 in-between each leg.
As a matter of fact, the entire 22-month move can be divided into four large rallies separated by corrections of 9.3%, 11%, 8% and 16%. And each leg up in the market happened in multiple big segmented moves of around 8-11% on average over 12-15 trading days and each of those were further broken subdivided by small 2-4% pull-backs. The table below, outlines each of those segmented rallies and their associated pull-backs. In fact, the table below, outlines exactly how this entire bull market proceeded from the lows to our recent peak of $503 a share. Notice how the current rally is exactly in-line with the averages:

If you take a close look at the table above, you should notice a few things about this current rally that began on September 6, 2024 off of the $448.19 lows. First, the rally has lasted 10 total trading sessions (including this past Friday). If you look at the recent averages, we tend to see a peak at around the 10-15 day mark. So from a time perspective, we’re getting rather close.
From a percentage gain perspective, we’re actually right in-line with the average. The average backing out 3 standard deviations is 8.06% and exactly 9% with the full average. At 8.49%, this rally is right in-line with the typical rally. A larger rally might go for around 10% which would take the QQQ up to $492.97.
This is a big reason we believe the NASDAQ-100 will soon embark on a sharp near-term pull-back of around 2.5-4% which is right in-line with the typical range as outlined in the table above.
When you take the trend outlined in this table above together with the RSI analysis we presented in section (1), you can see how we’re getting really close to a near-term peak in the NASDAQ-100.
But those aren’t the only reasons we believe the market is close to a near-term peak. It’s important to note that we’re also at a key line of resistance of $485.50 for the QQQ and all-time highs for the SPY. The indices bumping up against key resistance levels just as they simultaneously approach the end of their (1) overbought cycles and (2) historical price/time range for these segmented rallies strongly indicates we’re nearing a peak.
Furthermore, with the fed now in the rear view mirror and the market having taken off on a delayed reaction, seeing some near-term profit taking makes a lot of sense at these levels.
Intermediate-Term Outlook: Markets have either already begun or will soon begin a march to substantial new highs
As you can also see from table 1 above, the average pull-back off of overbought conditions on the NASDAQ-100 lasts only 5-6 days on average and results in only 2-4% of downside. But after that, we tend to see another big leg up much like the one we just saw between September 6 and last Thursday. That’s where our intermediate-term outlook kicks in.
We believe after the NASDAQ-100 sustains a small 2-4% pull-back over a period of 5-6 days (beginning sometime in the next week or so), followed by a new big rally toward all-time highs.
We’ve already thoroughly outlined many of the reasons why we believe that to be the case in the last two weekly roundups. The first article, entitled “Double-Correction: Where’s the Bottom and How to Navigate the Turmoil,” essentially outlines why we believed the correction wasn’t going to make new lows beyond what we saw on August 5. Last week’s weekly round-up, entitled The Looming Fed Pivot Moves Markets to Crescendo,” continues where the previous week left off by adding further support to the arguments already made.
The summary arguments are as follows. First, because the NASDAQ-100 retraced nearly 80% of its losses of the first correction during the post August 5th rebound, the bullish momentum already flipped to the buy side. Historically speaking, it is very rare to find many instances where the market retraces more than half of its losses and then goes on to make substantial new lows. It’s happened to be sure, but it’s the rare exception.
The second big reason we believe the intermediate-term outlook is about to flip to the buy side pushing the market to new all-time highs is the fact that corrective periods as a whole tend to be short-lived. Whether we have one correction, or three corrections like last November, once the markets have trended sideways to down for a good 40-50 sessions, we tend to see the markets move on. With the only exception being a full-blown bear market. And in those cases, we tend to see substantially heavier selling in the first leg down than what we’ve seen. What’s more, the fundamentals don’t support a shift toward a bear market. To give you an example of what it takes to push the indices into a bear market, the last two occurred in 2008 and 2022 respectively. One was brought on by the financial crisis and the other by an unprecedented surge in inflation not seen in 40-years.
The market doesn’t go into bear mode every time we hear the economy faces a threat of recession. If that were the case, the market would be in perpetual bear mode. The point is the indices require a very tangible and realistic economic threat to enter into full blown bear market and we simply don’t have that at the moment.
It’s for that reason we believe this corrective period is nothing more than a once-in-a-year bearish consolidation that lasts 30-50 trading sessions on average. Last year’s lasted 71 sessions total. This one has reached 52 sessions from the $503.52 peak in early July to the $482.44 close this past Friday, September 20.
the risk of a final Re-test
One thing worth mentioning is that there is a very real risk that the NASDAQ-100 might retest its September 6 lows. With the QQQ facing a near-term pull-back for the reasons we explained above, there’s always the risk that pull-back goes further than expected. Especially when we see a pull-back off of key resistance like we have. I could see the markets extending the bearish consolidation period another 20-30 sessions up to the same 70 session corrective period we saw between July and November 2023. That’s about how long it would take to see the NASDAQ-100 test its lows, bottom and then rally back to its all-time highs.
Notice this makes very little difference to our portfolio and is only a risk for short-term investors. For our long-term time horizon, whether the market goes through another pull-back cycle simply doesn’t matter. Ultimately, the markets are going to end this consolidation period with another sharp move to the upside. Here’s how something like that might look like:

Nvidia (NVDA) lagging but not for long
Last week, Nvidia (NVDA) moderately underperformed as it closed out the week in the red. The NASDAQ-100 (QQQ) by comparison, closed up nearly 2%. We don’t typically see that level of underperformance out of Nvidia (NVDA) and it could mean we get a final buying opportunity in the stock ahead of its next leg higher.
As we mentioned above, as goes the NASDAQ-100, so goes Nvidia (NVDA). With the NASDAQ-100 (QQQ) due for a 2-4% pull-back very soon. that is likely to put some downside pressure on Nvidia (NVDA).
And everything we outlined above ends up panning out, it’s possible that this upcoming pull-back in Nvidia (NVDA) may be one of the final opportunities to buy the stock in this corrective period.
Just like we saw last year between June and November 2023, Nvidia tends to enter long drawn out consolidation periods ahead of the next step-up in the stock’s trading range. That’s something to cognizant about for those investors still waiting to find an entry. Nvidia (NVDA) isn’t goin to hang around these levels forever. Once this consolidation period ends, we’re likely to see a permanent step up in the trading range up to $130-$160 zone.

stretching the correction into october would align to mag 7 earnings late october to start the rally.