We’ve had a lot of important data releases, catalysts and big market set-ups over the last month or so. But none of these weeks have been more important than how the market trades in the upcoming 1-3 weeks ahead.
How the market closes out this week — and in the ensuing weeks ahead — has major implications for the broad cyclical trend in the NASDAQ-100. It’s important to understand that since the market bottomed in December 2022, the Dow, S&P and NASDAQ have all traded in a very particular cycle. Our focus here at Sam Weiss is on the NASDAQ-100. However, the market as a whole has followed a very similar broad cyclical trend and that cycle is now being heavily tested.
Intermediate-term Cycle: How the bull market has unfolded thus far
For the NASDAQ-100, the broad long-term trend has unfolded in the following general way. The NASDAQ-100 will first embark on a large intermediate-term rally of 20-35% lasting anywhere from 70 to 100 trading sessions (3-5 months) during which it may have 3-4 smaller near-term pull-backs of 2-4% each. The intermediate-term rally will eventually end, the NASDAQ-100 will sustain a larger 8-15% correction and then promptly begin a new 70-100 sessions rally without delay.
That has been the consistent cycle we’ve seen going all the way back to December 2022 and in the 3-4 years prior to the 2022 bear market. So this trend has really been going on for a good 5+ years now with the 2022 bear market pausing that trend briefly for a year.
The table below shows exactly how the current bull market has unfolded on an intermediate-term basis from the lows of December 2022 to the $493.70 highs of this current rally.
Table 1: NASDAQ-100 (QQQ) Intermediate-Term Rallies 2023-2025
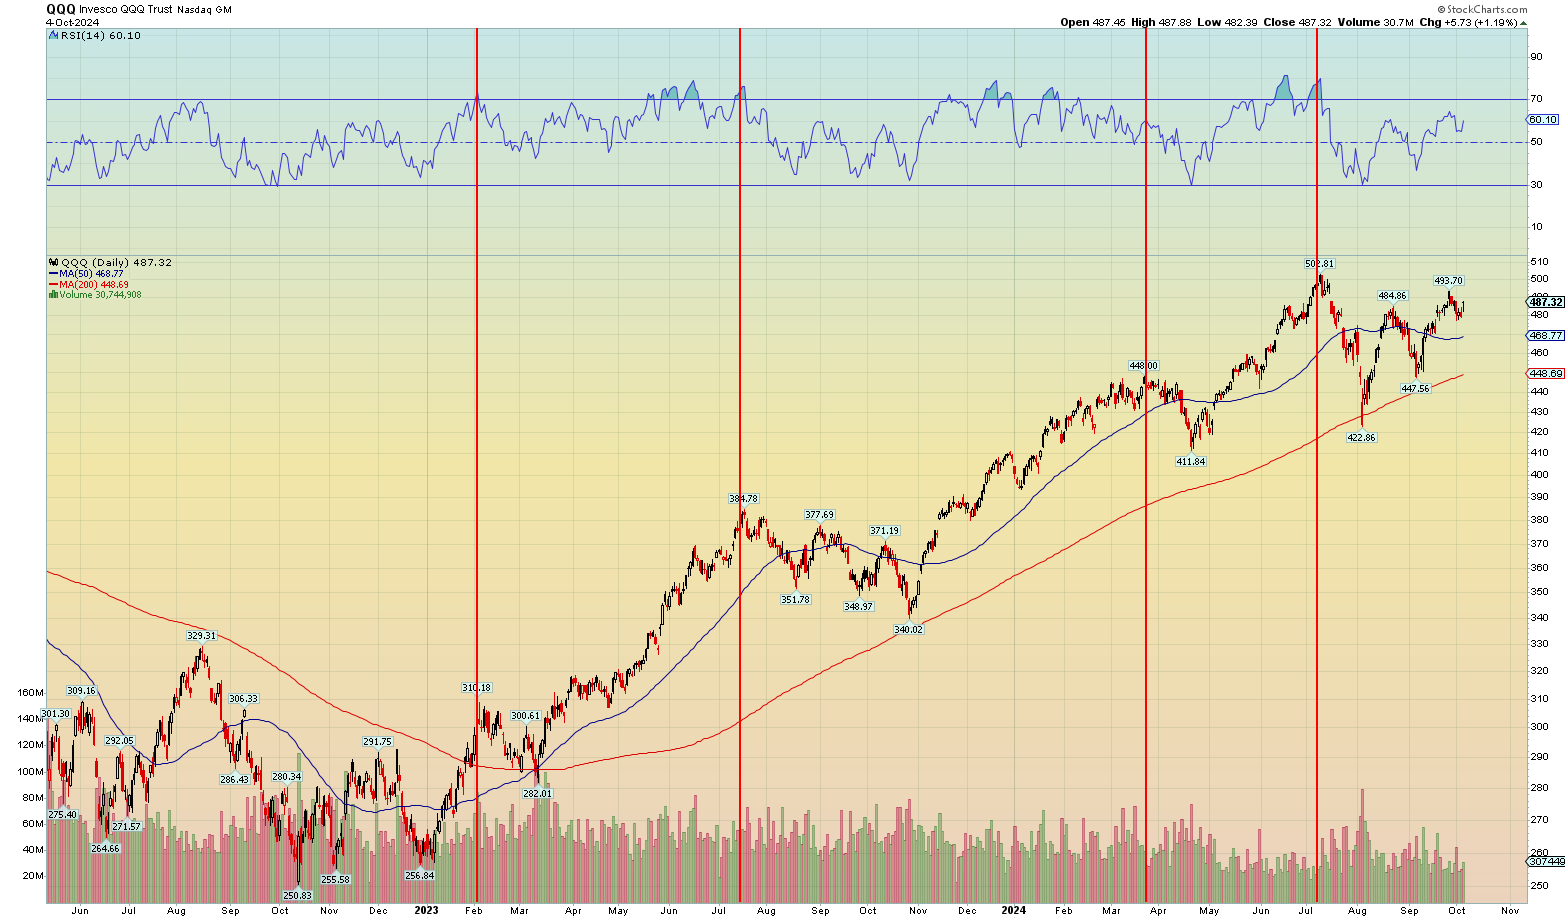
Notice the entire bull market can be viewed as five separate intermediate-term rallies averaging 25% each, separated by four corrections averaging 11.17%. This current rally is on the low end of the range in terms of both duration and percentage gain (16.75%/46-days). The chart below gives a more visual representation of the entire bull market run with each red line marking the peak ahead of the four above mentioned corrections:
Near-Term Cycle: Repetitive & Consistent
On the short-term time-frame, each of these broad intermediate-term rallies could be further subdivided into near-term rallies and near-term pull-backs. What we’ve found is that the NASDAQ-100 tends to rally 8-9% over 15 trading sessions on average before peaking and pulling back 3-4% over the next 5 sessions. The general trend has been 3-weeks and 10% up to 1-week and 3-4% down. We’ve seen a FULL 20 of these very precise trading cycles going back to December 2022. It’s uncanny how consistent this trend has been. The table below outlines each of those short-term rallies, peaks and pull-backs in their entirety:
Table 2: NASDAQ-100 (QQQ) Short-term Rallies & Small Pull-backs 2023-2025
Why the next few weeks are critically Important
Now that we’ve outlined how this broad trend has unfolded on both the short and intermediate-term time frames, here’s why the trading action for the next few weeks is really important. Let’s begin by talking about the near-term situations with the NASDAQ-100.
If you look at the table directly above what you’ll find is that the NASDAQ-100 (QQQ) just recently peaked at $493.70 after a 10.32% rally lasting 15-trading days. Both the number of sessions (15-days) and the gains (10.32%) are well above the averages of 12-days and 8.89% respectively. So that recently rally on the NASDAQ-100 was a rather robust rally on the larger side of the spectrum.
What’s more, the QQQ recently pulled-back $16.30 or 3.30% over 4 trading days which is fairly in-line with the average pullback of 3.6% on 5-days. In fact, those numbers are extremely close to the average.
Furthermore, the NASDAQ-100 has since rebounded almost a full $10.00 off the lows closing out the week at $487.32 or 2% higher. Now here’s why this is critically important for the overall trend. If you look at the table above, what you’ll find is no dithering when it comes to these rallies. The QQQ goes from one rally to a sharp pullback of 3-4% right into the next rally. Sometimes we’ll get a retest with the NASDAQ-100 pulling back toward the lows before exploding higher. But after that, the NASDAQ-100 immediately resumes its trend higher.
Thus, what we should see from here is a straight shot up to $520.00 a share on the QQQ over the next 3-weeks. That would be inline with the typical 8.89% average rally over the very typical 12-15 trading day cycle. Hell even if this upcoming rebounded merely matched the lowest rally of 5.01% over the next 7-days, the NASDAQ-100 should still end up testing its all-time highs of $503 a share.
Now as I just mentioned above, sometimes we’ll see the NASDAQ-100 retest the lows. That can easily happen here with the QQQ pushing up against its $487-$489 resistance zone. We saw one such retest happen back in June when the QQQ first reached $485 for the first ever. Back then, we saw the same exact 3-4% pull-back, a bottom, a sharp rebound and then a full retest. Take a look at the chart below and notice the similarities between the current period and the June 2024 pull-back and retest:
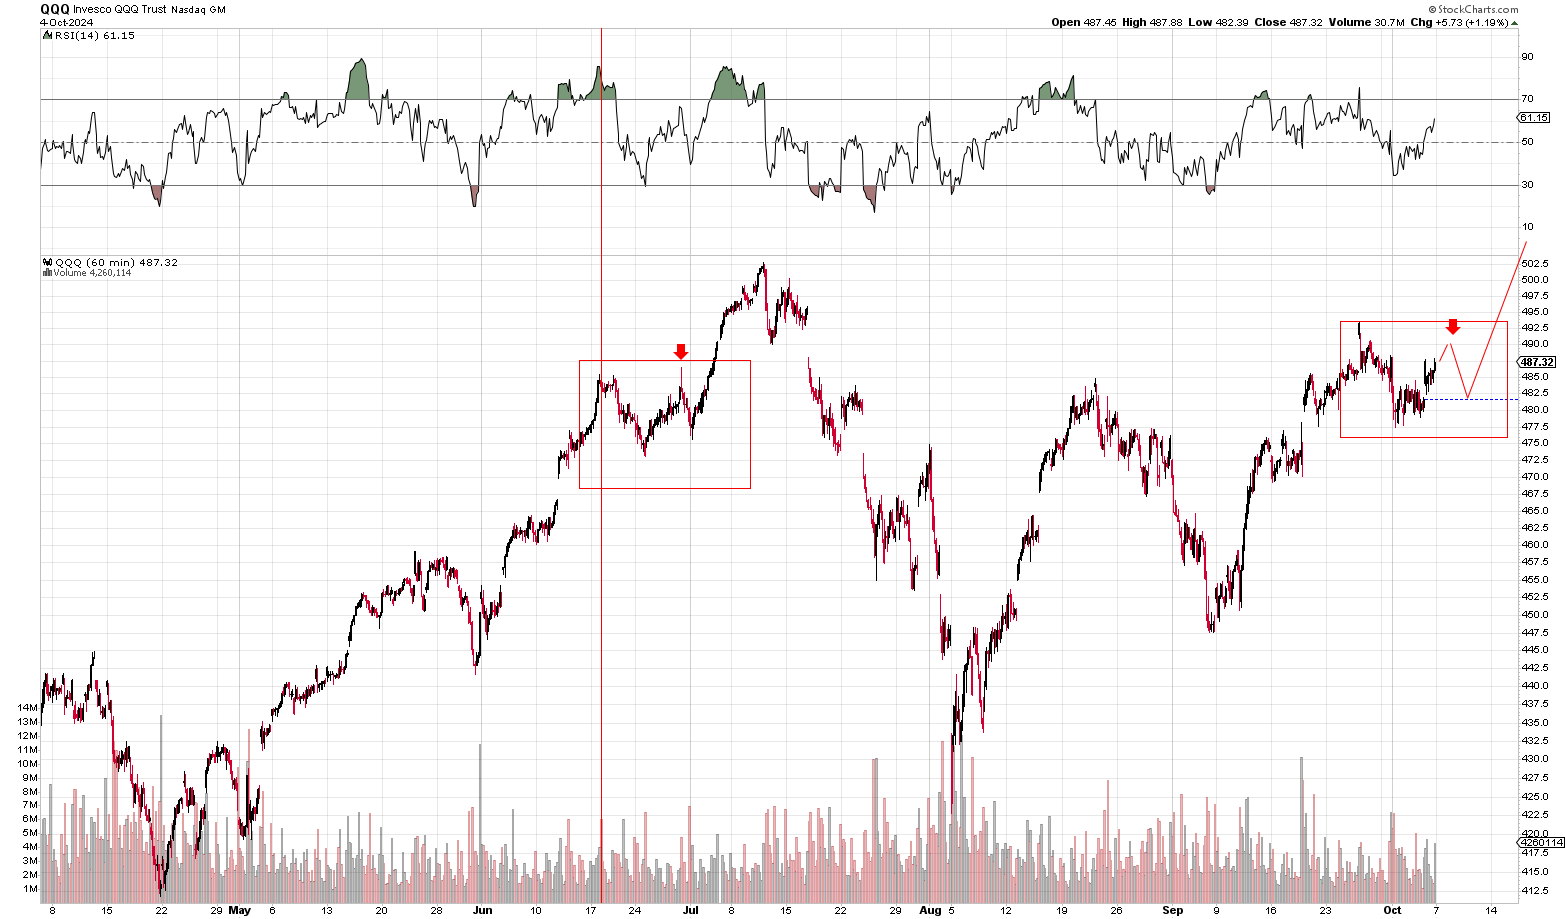
The take away here is that it’s not uncommon to see the NASDAQ-100 retest its lows on a pull-back. It doesn’t have to happen. But it certainly can happen. If we get a retest of the lows, it doesn’t necessarily mean that the trend has now become invalidated is the point here. We can see a retest of the lows next week and then watch the QQQ explode higher on the ensuing 2-3 weeks as it delivers new all-time highs.
The Samwise Intermediate-Term Outlook
Now let’s move on to the intermediate-term outlook and the associated risks we really need to be thinking about here. On an intermediate-term basis, the NASDAQ-100 (QQQ) really is at a critical crossroads now.
It’s important to remember that in 2023, we watched the NASDAQ-100 sustain THREE (3) separate back-to-back corrections with three significant back-to-back rallies in-between. This year looks like a larger version of the 2023.
Back in 2023, we had three 8-9% corrections followed by three 9-11% rallies. The total corrective period lasted a full 71 trading days where the QQQ lost 11.63% from its absolute peak in July to its absolute trough at the beginning of November 2023.
But what we saw back then was a clear-cut explosion to the upside. After the NASDAQ-100 bottomed in early November 2023, it went on to rally $50 straight up to fresh all-time highs. And the rally didn’t stop until the QQQ reached $413 a share which was a full 7% above its previous highs. And even then, that pull-back was nothing more than a brief pause ahead of further upside that took the QQQ all the way to $450 a share or $110 over 100 trading days. So the rally off the lows was very clear-cut and one directional.
This current corrective period, by comparison, has lasted nearly as long as last year’s but without the same clear-cut move to the upside. While the NASDAQ-100 has almost fully recovered its losses sustained in August, it still hasn’t put in fresh all-time highs with clear-cut big white candlesticks leading the way.
In our estimation, the greatest risk we have right now to the intermediate-term outlook is that the QQQ can simply embark on a third leg lower. Until the NASDAQ-100 pushes through to fresh all-time highs, there’s nothing stopping the NASDAQ-100 from going there.
Notice that our “base-case” or what we expect to happen from here is a breakout. We believe the NASDAQ-100 is likely pushing through its all-time highs in the next two weeks. That has been our base case all along. After a brief 3-4% pull-back — which the NASDAQ-100 has already completed — our expectation is for the QQQ to push toward $520 a share. See below:
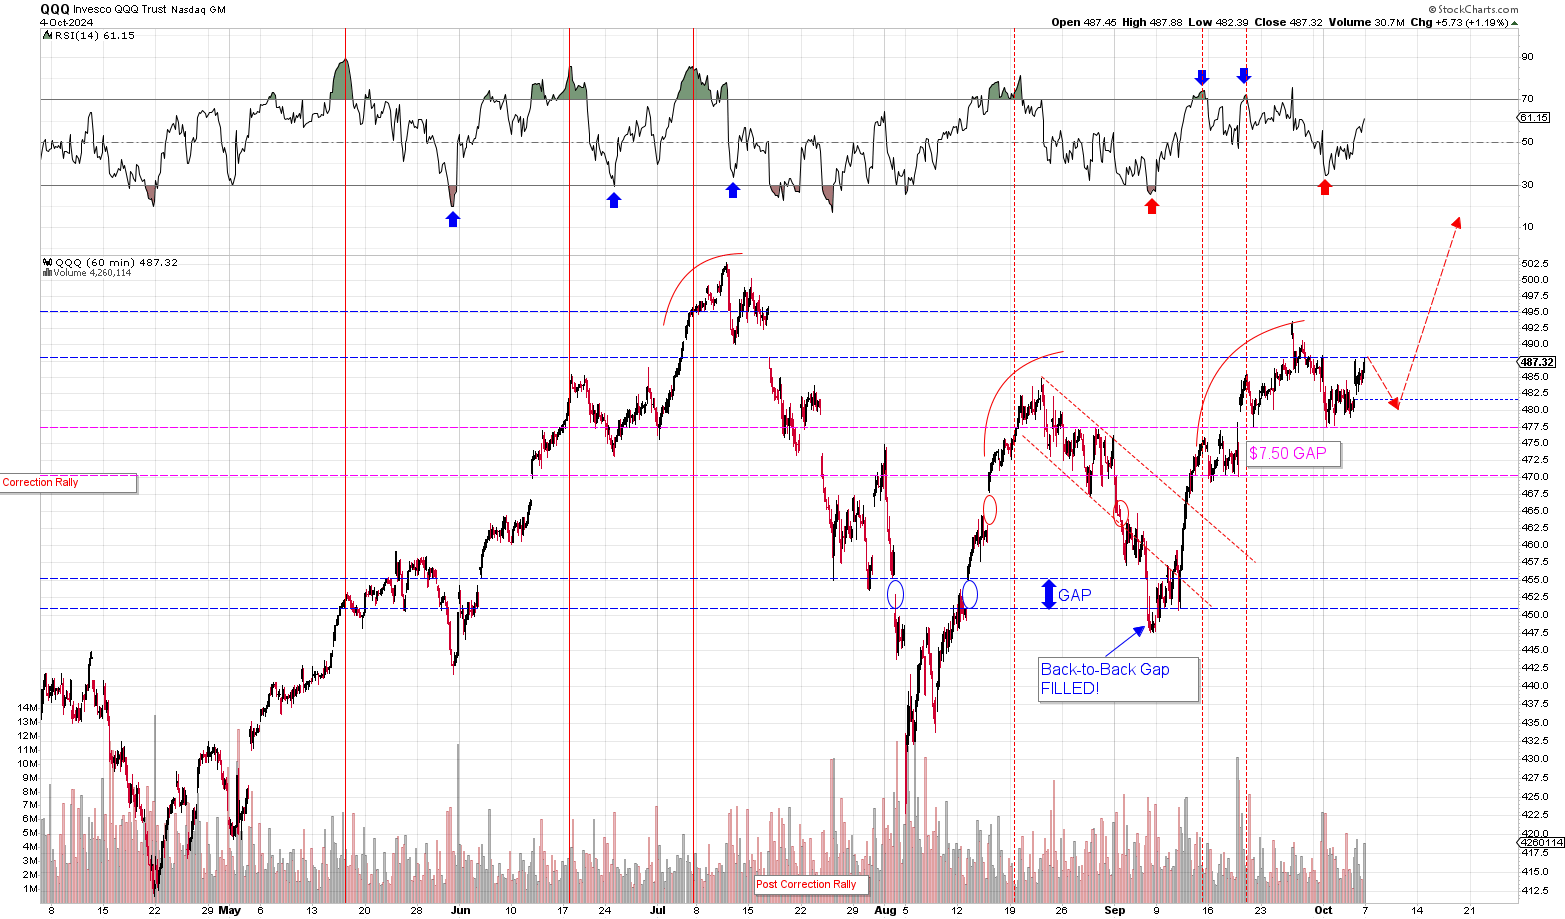
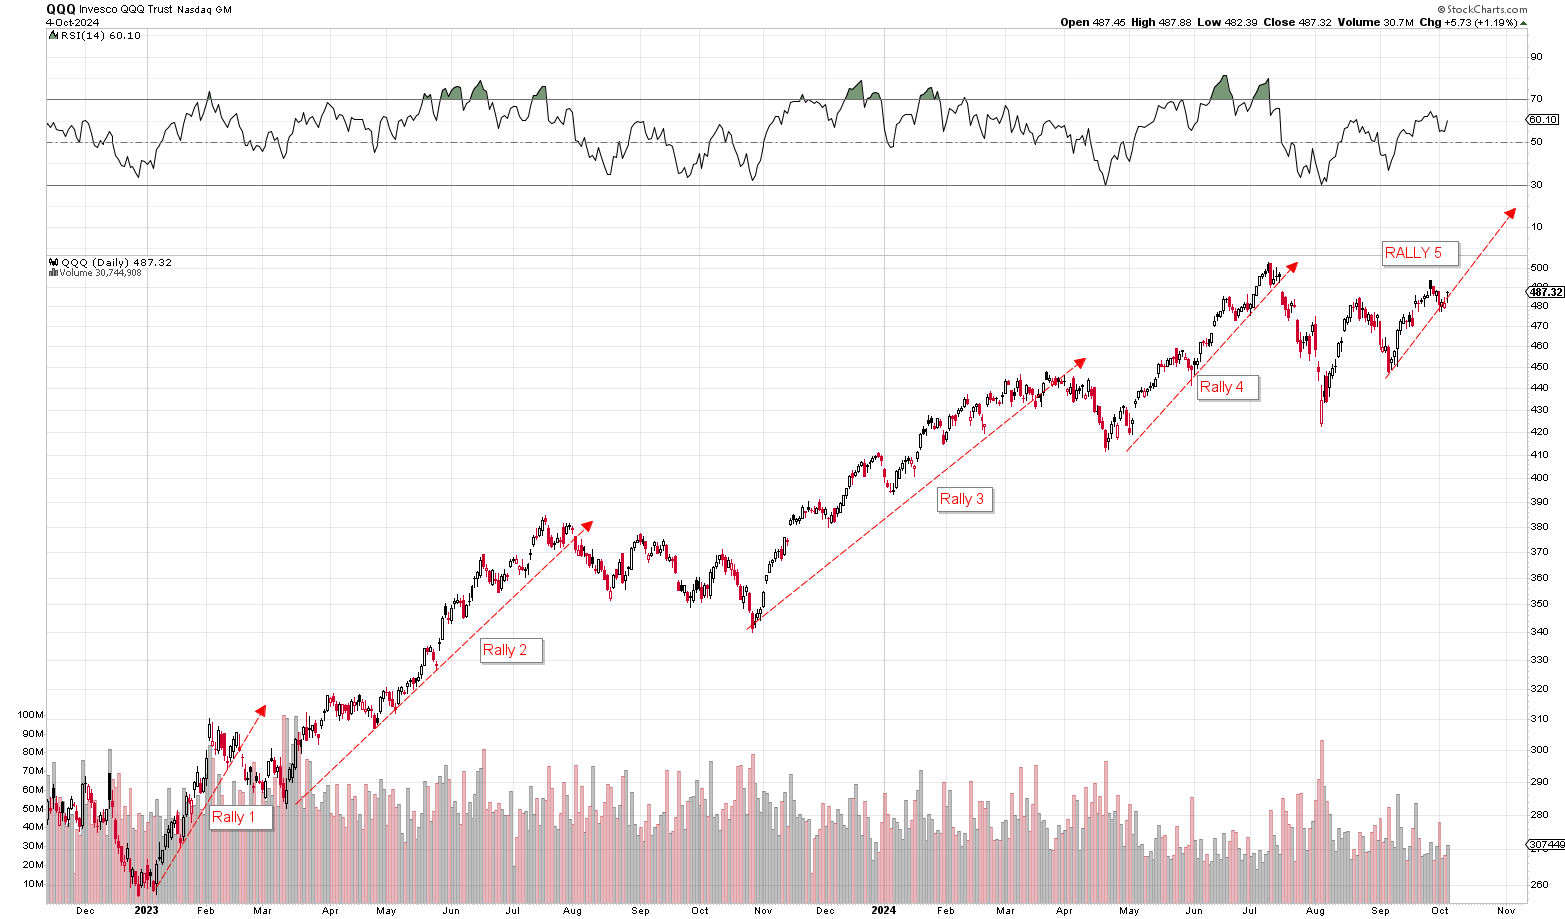
So these two charts above outlines our “base case” or what we expect to happen over the next several weeks. Whether the QQQ retests last week’s $477.40 lows or not, our expectation is that the NASDAQ-100 likely rallies back to its all-time highs and inevitably pushes up to $520 a share during this next leg up over the intermediate-term time-frame.
With that being said, there is a non-insignificant risk that the QQQ could push for a third leg down not unlike what we saw last November. While the shape and form of this corrective period might be different, the volatility is very similar.
But I’ll be honest, even if that were to happen, it would be a buying opportunity. That is because this corrective period will have extended to well over 70 sessions — just like last year — and these periods tend to be short lived.
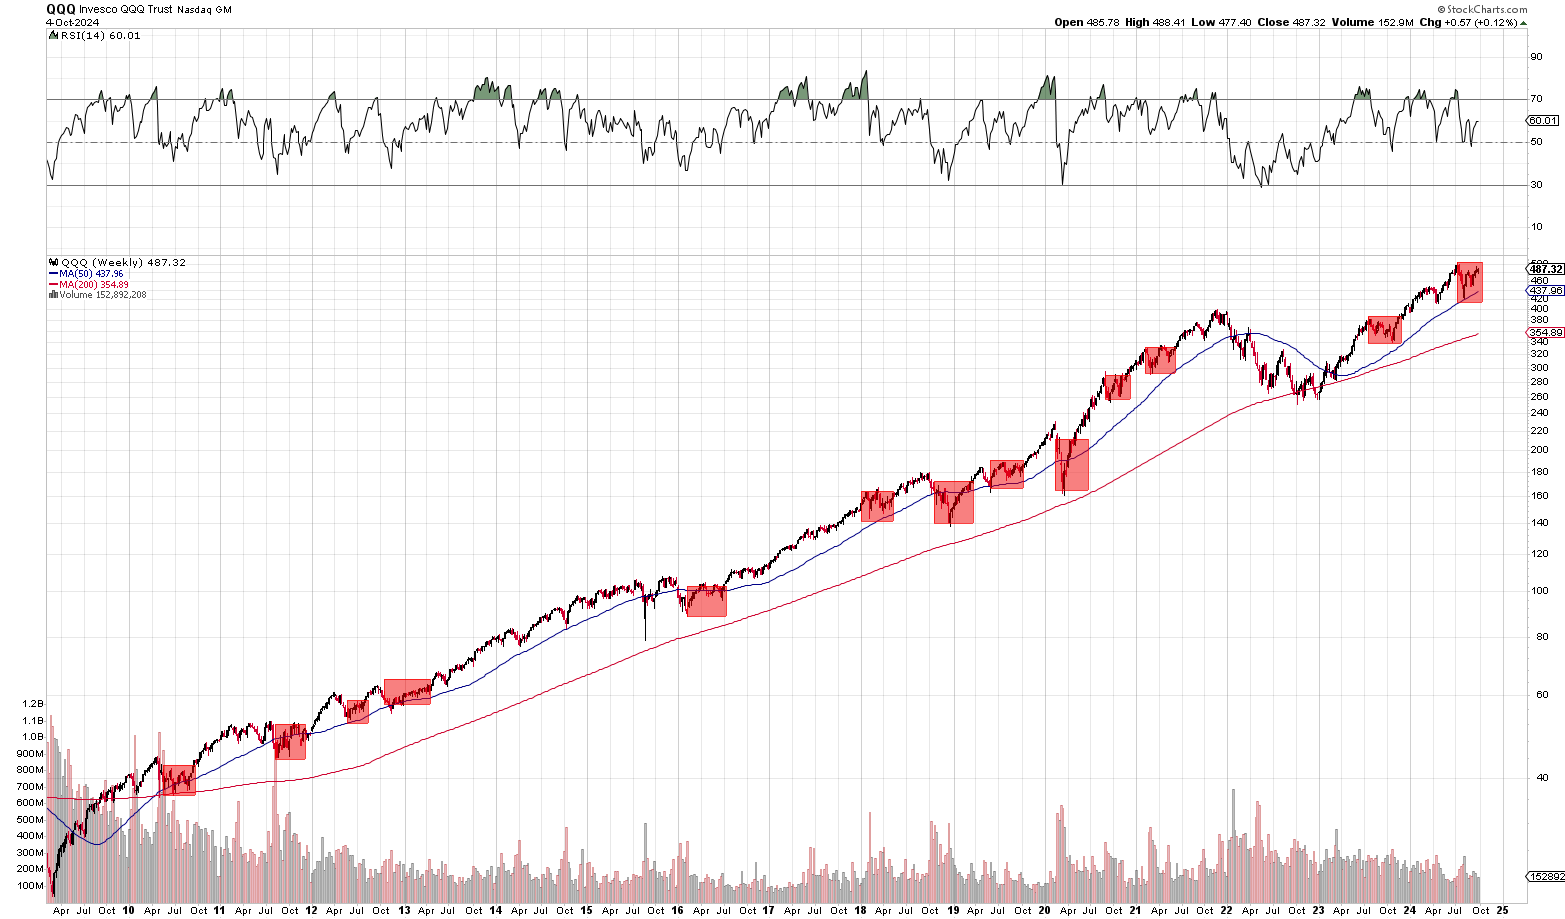
If you go all the way back to 2009 and to the period before the financial crisis but after the 2000-2003 bear market period, what you’ll find is that these corrective periods don’t tend to last much longer than 70-80 sessions at worst. For example, take a look at this WEEKLY chart going all the way back to the financial crisis. This chart covers a 16-year period of time. Notice how these corrective period don’t tend to go much beyond 3-4 months and generally precede a major leg up in the markets:
Samwise Portfolio & Investment Strategy
As the Samwise Portfolio and our investment strategy is going forward is concerned, here’s what we plan to do. As we’re already 83% long in our options portfolio and 75% long in the common stock portfolio, we’re good with whatever comes next. If the market does continue to follow our base case as expected, we’ll be purchasing puts in both portfolios to hedge against long-term downside risk to the portfolios. If the NASDAQ-100 decides to embark on a final leg lower, then our plan is to get long with the remaining cash on the sidelines and then we’ll hedge out the positions on the ensuing rebound.
As our positioning is concerned, this is all pretty straight forward. While we don’t expect the QQQ to embark on a final larger pullback before moving higher, obviously a larger pull-back would be good for us overall as we’ll be able to add to our long-term positions.
The $5k to $1M Challenge Portfolio
As the $5k to $1M Challenge Portfolio is concerned, we will put on our first trade in the event the NASDAQ-100 retests its lows next week. What we’d like to see is a gap-fill of the $470 level on the QQQ before we make any trades in the portfolios. And seeing as how we would be making a trade outside the bounds of a full correction, we’d likely be looking at either a non-spread trade or one that is heavily hedged at the point of purchase.
Nvidia (NVDA) Outlook: the Road to $150
As we mentioned last week, there is a big possibility that Nvidia (NVDA) may have exited the sub-$120 space with the recent surge to the upside. With the QQQ having pulled back 3.3% from its recent highs and with the QQQ likely making a push to fresh all- time highs, it is very likely that Nvidia (NVDA) is pushed up to $130+ on the rally. And once Nvidia (NVDA) breaks above $130, it’s over at that point.
Remember, as we’ve previously discussed a number of times in recent weeks, NVDA has been in an extended consolidation period for over 4-months now. The closer Nvidia (NVDA) to its next earnings report, the closer it is to breaking out of that range. We’ve seen consolidation periods likely this in the past and they invariable lead to a breakout into the next trading range.
These consolidation periods are very necessary as it gives investors the a chance to take profits and it gives new investors the opportunity to buy at a relative discount to the stock’s highs. The P/E ratio also has a chance to contract as higher EPS brings those numbers lower.
The last major consolidation period ended last December 2023. From there, Nvidia (NVDA) promptly embarked on a 100% rally from $45 up to $97 a share. While it’s doubtful that we’ll see a move that big here, there will be significant upside on the next breakout run that takes Nvidia into the $150-$160 trading range.
Even if the Nvidia’s (NVDA) consolidation periods extends another quarter, it’s clear the stock has found heavy support in the $110-$120 range and unlikely to see prices below $100 again. Furthermore, whether Nvidia breaks out toward its $150 highs now or whether it happens in December-January doesn’t really matter all that much to us. We’re positioned to capitalize on the move all the same.
That being said, we do believe the consolidation period probably ends toward the end of this quarter and that Nvidia (NVDA) is likely to run at some point in time between now and when it reports earnings.

Hi, first I would like to say that I have learnt alot from your analysis. Even a beginner like me is able to understand.
I see that you bought Nvdl.
May I ask, will it be a good idea to hold this leveraged nvda for months going thru the coming several mini pullbacks & large corrections?
Will the decay be much after going thru these?
Just to add on with Mavleen’s question here: Is there a reason why you picked NVDL over NVDX? Both are 2x leveraged etf.
Thanks Sam!
(1) Holding NVDL Long-Term
So I’ve done some analysis on NVDL and posted that in one of the daily briefings and a little big in Chapter 2. What I’ve found with NVDL is that it has performed very well long-term. Management has done a good job managing both the daily and long-term returns on the fund despite the higher expense ratio. It does make up a relatively smaller part of our overall position in Nvidia (NVDA) within our higher risk portfolio. For the time being, our strategy is going to be to hold it long-term. Historically speaking, NVDL has done well over both the short and long-term.
(2) NVDL v. NVDX
So NVDX has thus far performed better than NVDL with a lower expense ratio. But the main reason we’ve opted for NVDL — despite NVDX’s growing popularity and explosive growth in AUM — is that NVDL has simply been around longer. It has a longer track record.
I’m not a big fan of leveraged ETFs in general and a short track record for me just doesn’t cut it. So far NVDX has done well and it probably will surpass NVDL in terms of AUM. NVDL trades at 10x the volume of NVDX at the moment. But that is shifting.
But again, the biggest factor is track record and NVDL has performed way above its implied bench mark over the long-term.
The last two years the QQQ growth was driven by AI and especially NVDA. Dont you think the hype matured along with the valuation of NVDA, so the QQQ wont see these kind of rallies in the future until a new hype is born?
Also the s&p 500 reached a P/E of 30. Whenever that happend, it had a significant crash (dot com bubble, financial crisis, covid). I definetly didnt do any further research on this, so this might not be related at all. But since you seem to have a good understanding of market cycles and trends, how do you evaluate this fact?
This is a really good question. I’ve added it to my daily briefing and answered it there. Thanks for the comment. I wasn’t sure if you wanted attribution, so I just left it anonymous in the post. If you don’t mind attribution, I’ll give it you.
But take a look at today’s daily briefing as a response. The summary is this. The way to deal with the 30-PE ratio — which definitely is a problem — is to simply remain long and hedged.
We remain long because the long-term bias and direction of the market is always higher and you can’t know for sure how the market will deal with the higher valuations. We’ve seen markets remain very overextended for years. So the way to address the risk is to simply hedge it out using puts and covered calls.
I don’t mind Attribution. Can’t read the daily right now, because currently not subscribed, but I appreciate your time in the comment section, especially your weekly outlook and the answer which i understand (long bias + hedge). Just one thing. I’m not really into option trading and I’m from Europe. I even think we cant sell covered calls. Do you have experience in alternative hedging plays? I do have to do some research on this.
I have some friends in London who’ve traded covered calls in the past. Different groups of friends actually.
Covered call writing is a very basic and fundamental hedging strategy. I’d be very surprised if any advanced or developed nation didn’t grant access to the strategy.
But it is broker dependent. As options are concerned, it’s generally the lowest tier of options. It’s at a lower risk tier than buying options in the United States and requires less scrutiny.
But as to your original question, without delving too deeply into it.
There are always major risks in the market that might keep an investor out of the market. For the last 20 years, that has largely been a mistake given the gains we’ve seen.
Chances are as the world population continues to increase, and as the world-wide standard of living increases, economic growth continues on an expansionary heading. Meaning, we’re likely to see continued stock gains for the time being with the errant bear market here and there.
Thus, as a broad general strategy, it’s generally wise to be long the market, well diversified and hedged against the possibility of a bear market than it is to be on the sidelines.
At least, that’s what we approach it. Long and hedged.
Valuations are definitely stretched and there is a correlation between a 30 P/E and market peaks as you well know. Though the same size isn’t all that great . The few times we did venture north of 30 in the past 25 years, it hasn’t gone great.
But due to the small sample size, we don’t have a strong casual link. At least not a strong enough one to justify being in cash versus going long-hedged.
Sam – what price point would you be place puts as a hedge at?
We’re waiting for the next rally up to $500 to look at the hedges. We want to see the $VIX and $VXV come down to reduce our overall cost of insurance. Also, as the market grinds higher, we can more confidently sell covered calls.
Awesome! Will be you hedging your NVDA positions also? If so, what price point are you targeting that would come up at?
I just wanted to check if you see this as great options hack by increasing profit percentage of using premium from selling 0.5 Dec calls on Nvda.
You can have it as case with or without selling calls having 50k capital .
1. Using $50k to buy dec 2024 $80c for Nvda and see how much profit if it goes to $150 or so (I believe 21k as I can manage only 10calls to buy with $51k)
2. Using 50k to sell 20 $0.5c dec 2024 calls on Nvda and using premium I can buy like 50 calls on Nvda $80c dec 2024and see my profit percentage increased so much (close to $60k profit if Nvda ends up reaching $150 dec 2024)
Also I am using extra premium to save myself in case I get margin calls on naked puts I have sold on Nvda for all different expires
Hello. So this isn’t super clear what exactly you are doing here.
(1) $50k to buy December 2024 $80 calls at what price? Aer they $51 each? So $51 x 10 calls = $51,000?
(2) I don’t understand what’s happening there. “$50k to sell 20 $0.5c dec 2024” <--- this line is ambiguous. Not very clear on what is happening there. To really answer this question, I just need some clarity on what the proposed strategy is. I'm assuming you want to sell some naked puts at some strike price and use the capital to buy Nvidia $80 calls? ------- What I can say from reading the above is this. At Sam Weiss, we're mostly focused on very conservative high probability longer term trades. Anything that carries any sort of high risk of loss to capital, we're probably not going to do here. Also, we can't really give tailored individual advice given SEC regulations. All we can really do is outline what we're doing and why. We can only give general insights. Here's an insight I can give here. While Nvidia (NVDA) has traded in a consolidation period for a while now and while there's a decent chance the stock can breakout and make a run back to its highs by year end, there's no guarantee that it happens in December or January. While that has been the consistent trend, we could easily see a delay. The problem with near-term options -- something we're almost never going to do -- is that your timing has to be very precise. With the long-term, it requires little to no precision. We just buy and when the market is finally ready to go higher, we capitalize on the move. When we do make short-term trades -- as with the $5k to $1M challenge -- it will only be after a major correction happens where the probability of a big rebound is at its highest. And even then we'd be doing it hedged with short-term puts so that if the rally doesn't happen or if we go lower, we offset the losses.
We cover that in Chapter 3. We use covered calls to offset the cost of the hedge and roll the hedge forward. So for example, if we buy a 1-year expiring hedge and nothing happens this year, then we do the same thing next year. The sale of covered calls should help offset the cost of that hedge.
Is todays pullback in line with the 5-day pullback average?
It is for the time being. If the QQQ falls under $477.40, then it won’t be. Since the QQQ has technically bottomed already at the $477.40 level, the pullback only lasted 4-days. If a new low is made, then that will extend to 6-8 days.