Before I jump into the weekly roundup, I’d like to point out a few key updates to the site and some structural changes we’re making to the Daily Briefing to make the information more digestible. The changes should make it substantially easier to determine precisely what our near, intermediate and long-term outlook is on the market and give everyone a greater context to our analysis.
We’ll still provide updates throughout the trading day as we do now, but the Current Outlook tab will simply keep things hyper focused on our forecast. The intraday live updates will simply give color to the outlook.
To implement these updates, we’ve added the following pages and features:
First, we added a page under the Samwise Portal explaining how our Daily Briefing is to be structured going forward.
Second, we added a section to the website called the “Current Outlook,” under the Samwise menu tab, which will contain our most up to date near, intermediate and long-term outlook. That “current outlook” tab will be synced across the website so that it will always contain our most current outlook, timestamped with the specific date and time we posted it.
Weekly Roundup: Not much happening at the moment
With the indices currently consolidating at their all-time highs, there isn’t a whole lot to discuss in the weekly roundup. In fact, without the indices at overbought or oversold indicators and as the indices have gone off their regular cyclical trends, forecasting confidence is generally low right now. We’re long, hedged and simply in wait mode. If the markets move higher, we’ll add on our final hedges. If we end up with some sort of a correction earlier than expected, then it will not only increase our forecasting confidence, but it will give us some opportunities to put on some new trades.
We’re still waiting to put on our first trade in the $5k to $1M portfolio and waiting to launch our next pair of portfolios. Our current portfolios are all deeply in the positive and we’re mostly well hedged. We’re looking forward to expand those portfolios further. But we’re sort of in a low confidence sideways trading environment and simply need to wait for some form of volatility to return.
NASDAQ-100 (QQQ) Short & Intermediate-term issues
To see our short, intermediate and long-term outlook on the NASDAQ-100, all things considered, please check our Current Outlook. The analysis below will simply outline the risk factors, context and considerations for that outlook.
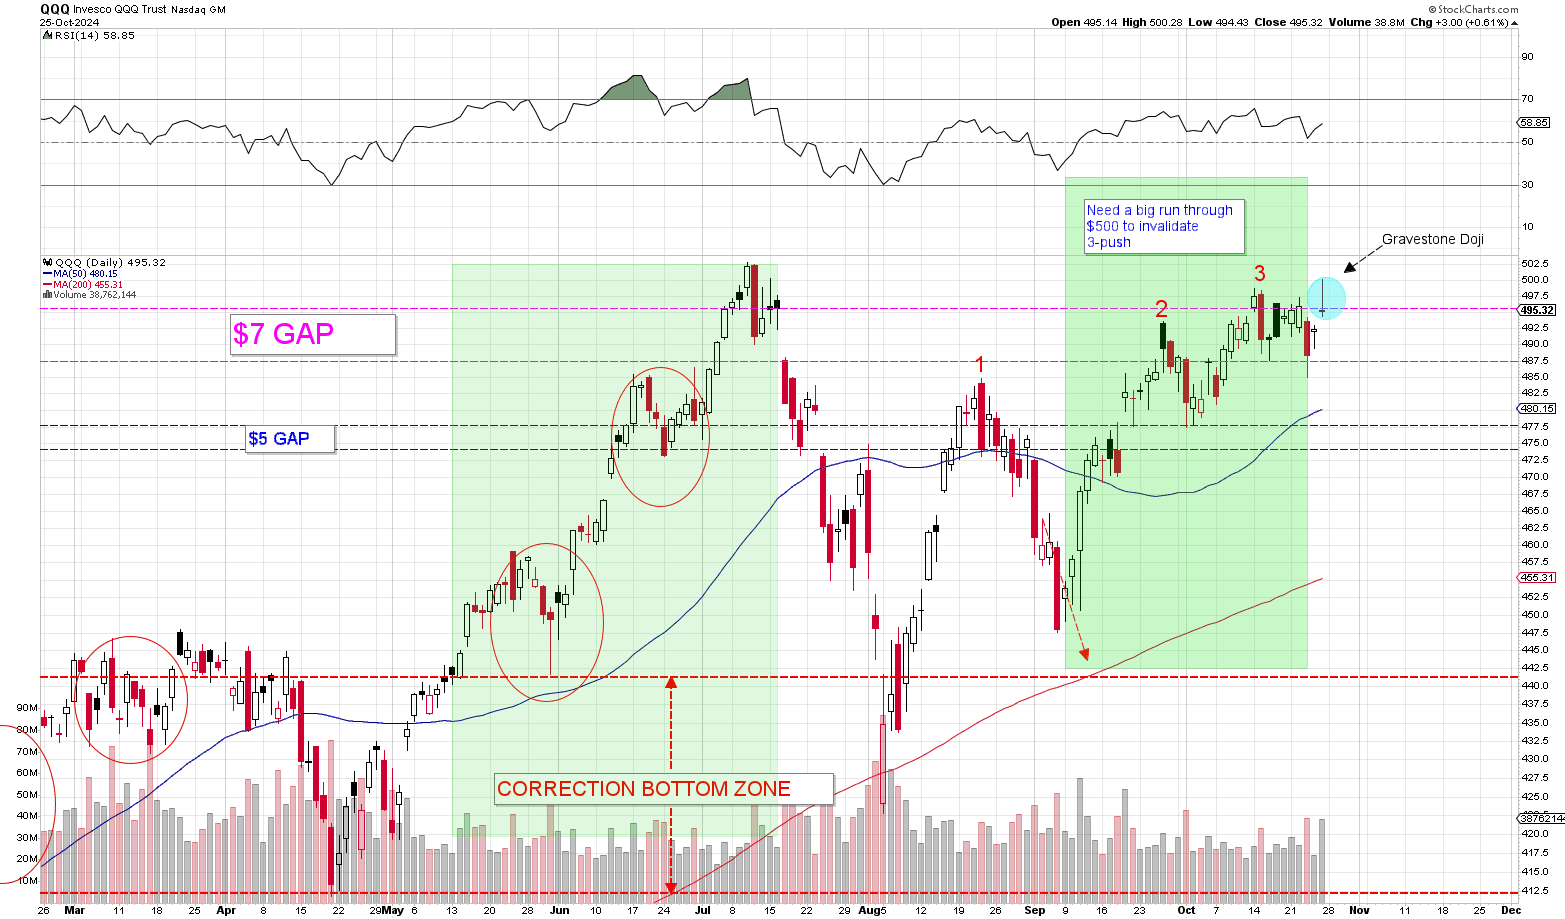
Risk Factor #1: NASDAQ-100 (QQQ) $500 is turning into serious resistance
Back on July 10, 2024, the NASDAQ-100 (QQQ) simply blew past and closed well above the $500 level like it was no big deal. I found it really odd at the time that there was literally no resistance at such a key psychological level like $500 and even texted some friends that I thought the NASDAQ-100 (QQQ) was likely headed for a substantial correction given how freely it pushed through so many would-be heavy resistance points. I just didn’t realize at the time how soon that correction would happen.
When a stock or market breaks through key resistance levels without much opposition, it often signals trouble for the intermediate term. This was exactly the case with the NASDAQ-100 in July when it briefly pushed above $500. What looked like a smooth breakout was quickly reversed as sellers stepped in. The day after hitting $503, the QQQ opened flat before a sharp $13 intraday reversal brought it down to $490.
In fact, when you really think about, the NASDAQ-100 only spent a single day actually trading above the $500 level before it was clear to market participants that the move was premature. Over the next three days, the QQQ repeatedly tried and failed to reclaim the $500 mark. This struggle was followed by an immediate 16% correction in the QQQ when it plunged from $503 a share on July 10 to a low of $423 less than 4-weeks later on August 5.
Now, after four months of moderate volatility, the NASDAQ-100 has finally made it’s way back up to $500 a share, revisiting that level for the first time since its initial surge in July.
And the trading action at $500 a share, thus far, has been less than encouraging. The QQQ took a shot at breaking through on Monday, October 14 when it gapped up from $492 to $495 a share and then surged up to nearly $499 a share in the first 30 minutes of trading. That $7.00 move in the AM provided fruitless as selling quickly took the index back down toward it opening price of $495 a share. While buyers made another attempt at $498 that day, the entire stock underwent a massive sell-off the following morning. That pull-back would send the QQQ a full 2.7% lower as it bottomed out at around $485 this past week.
The QQQ made yet another attempt to take out the $500 level on Friday and even briefly succeeded. For a few moments, the QQQ surged from $495 up to $500.28 before it was once again knocked down a peg closing out the day at $495.32.
Key Conclusion: The $500 level is turning into a point of heavy resistance for the NASDAQ-100 (QQQ) and it is proving increasingly difficult for investors to push through. It’s important to understand that the longer a stock or market trades below a key level of resistance, the harder it is for the stock/index to push through that key level of resistance. That is because the longer a stock/index trades at those levels, the more investors become nervous of a reversal and the more sellers show up. Furthermore, the longer we stay at such a level, the lower the buying ammunition as buyers pear back on the expectation of a reversal.
Risk Factor #2: Gravestone Doji Candlestick formed on Friday, October 25
Friday’s trading sessions constitutes a bearish gravestone doji candlestick which isn’t great for the short and intermediate-term outlook. The consolidation we’re seeing at the $485-$500 zone is generally bearish tilting given the preceding three push-up pattern we outlined weeks ago. That is all still very relevant and are risk factors to the Current Outlook.
A Gravestone Doji forms when a stock/index opens flat, rallies big intraday and then fully reverses the gains to close right near the opening price of the day. A doji is a candlestick of indecision and a gravestone doji is generally bearish because it indicates we not only have indecision, but we have a day where the bulls tried and failed to push higher. See here:

It should be stressed that taken alone, a gravestone doji is hocus pocus without follow through or other supporting evidence. Taken by itself, a gravestone doji isn’t very meaningful and most individual candlesticks aren’t highly reliable. In fact, doji candlesticks in general aren’t highly reliable unless they occur in groups. We need several dojis back-to-back, like we saw near the top in July, to draw any solid conclusions, one way or the other.
Risk Factor #3: Three Push-Up Pattern Still in Play
The Three Push-Up Pattern we outlined a few weeks back, and illustrated in the chart above, still persists as a major risk factor to the NASDAQ-100. As we noted back then, to invalidate a three push pattern, we need to see a clear surge away from the current trading range. Anything short of that forms a 4th push, 5th push etc. It’s a bearish leaning pattern. No different than if we had a three push down pattern on a downtrend. And in fact, that is precisely what bottomed the market in 2022. We had a clear-cut three push down pattern with no clear breakdown of the trend. That’s what preceded the reversal. We have the same thing here.
Notice that the three push pattern we have developing here is bearish for the intermediate-term time-frame. It impacts the larger trend going back to August. It’s an indication that the overall rally that began on August 5 may be winding down.
The NASDAQ-100 Outlook
You can review our outlook on the NASDAQ-100 by visit the Current Outlook page or viewing the tabs at the top of any Daily Briefing page. As indicated in the outlook, our forecasting confidence level is really low right now. We have a range of low confidence, moderate confidence and high confidence when it comes to our outlook. Given the risk factors we’ve outlined above, we have low confidence (51-60%) in the outlook.
Our expectation is that all things considered, we still believe the NASDAQ-100 is likely to breakout above $500 a share sometime this week and push to as high as the $510 level. We believe this because earnings season is likely to have a favorable impact on the NASDAQ-100 given how much the market is willing to rewards stocks for good earnings in this environment. Unlike the last earnings environment, this market has so far rewarded companies for delivering strong results and guidance. Chances are we’re going to see a breakout this week when the big hitters deliver their earnings.
Both our short and intermediate-term outlook is for higher markets ahead.
Nvidia (NVDA) likely to breakout to new highs this week
While our forecasting confidence for Nvidia (NVDA) is at the lower end of the spectrum at the moment as mention in our Current Outlook, we nevertheless have better visibility into Nvidia than we do into the QQQ at the moment. Unlike the NASDAQ-100, which hasn’t traded above its key line of resistance at $500, Nvidia has. Nvidia has spent the last few weeks getting comfortable above its key $140 level of resistance and even traded to as high as $144 a share.
Furthermore, given that Nvidia (NVDA) has already tested and retested its lows at $100 share TWICE during the past consolidation range, I think it’s unlikely for Nvidia to trade below $125 without a serious market correction and/or bad earnings. It will take a lot to get Nvidia back down below $125 and I think our forecast that Nvidia had separated the sub-$120 space a few weeks back will prove true.
We believe Nvidia has one of a few different paths ahead of it and each of those paths all point to new all-time highs.
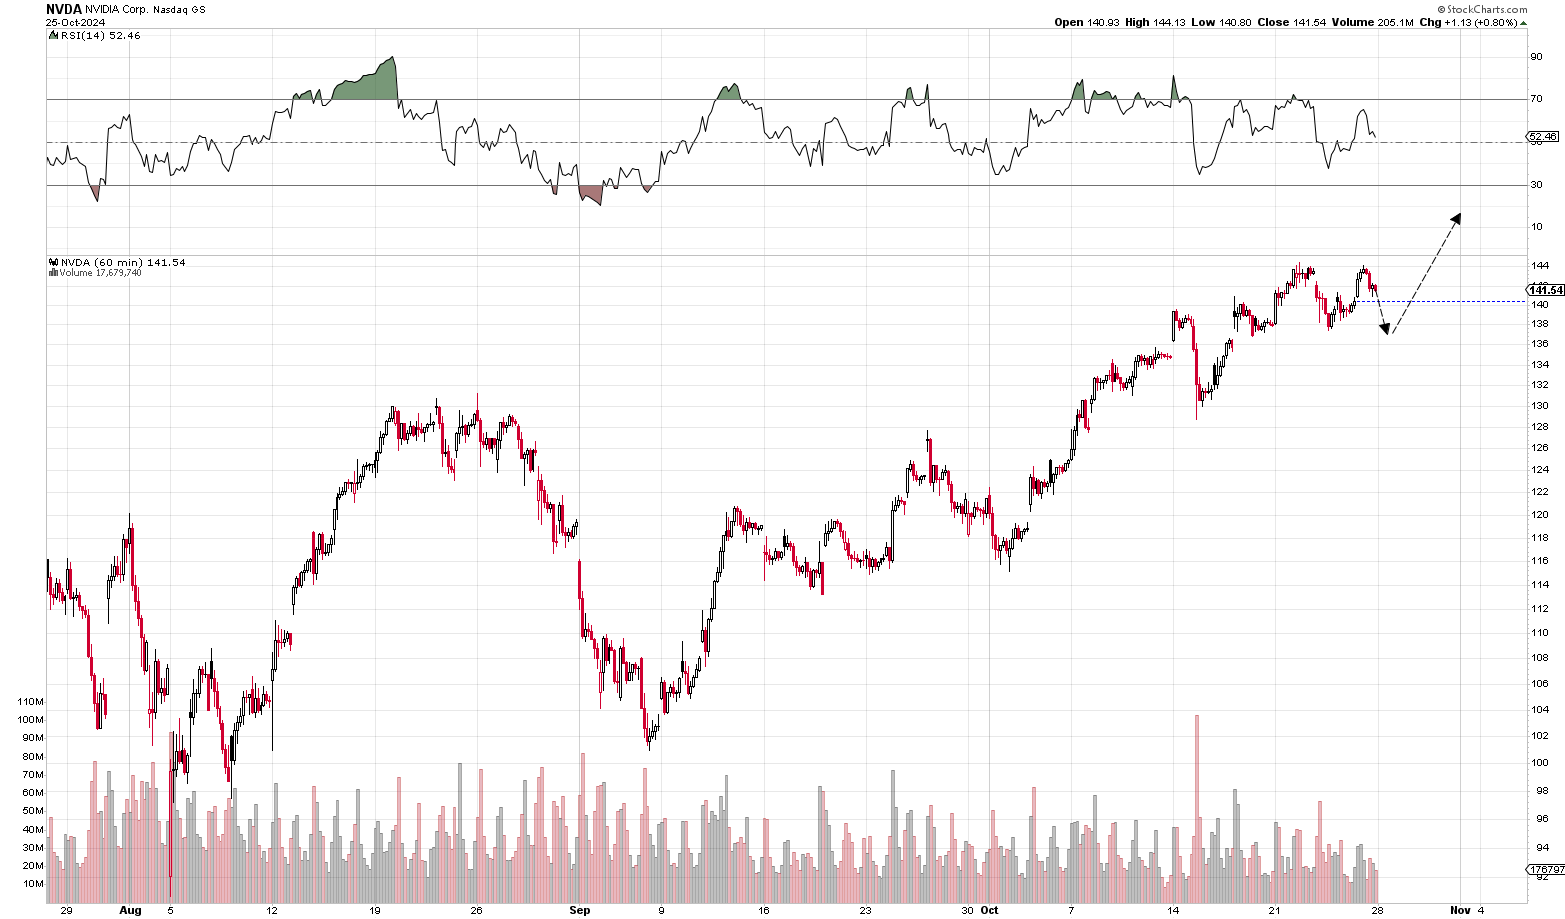
Scenario #1: Pull-back to $137, rally up to $148+
First, we could see Nvidia pull back a little and retest its $137 support level ahead of an eventual double-top breakout in the hourly. This is a common sort of trade set-up and with NVDA already pulling back $2.60 off of its highs on Friday, it’s already moving in that direction:

Scenario #2: Nvidia (NVDA) blows through resistance early this week
With the futures deep in the green right now — which can easily change by the AM — Nvidia (NVDA) could simply push right through its $144 resistance and finally make that strong move toward the higher $140’s. That’s definitely in the cards with this week’s big hitters reporting earnings.
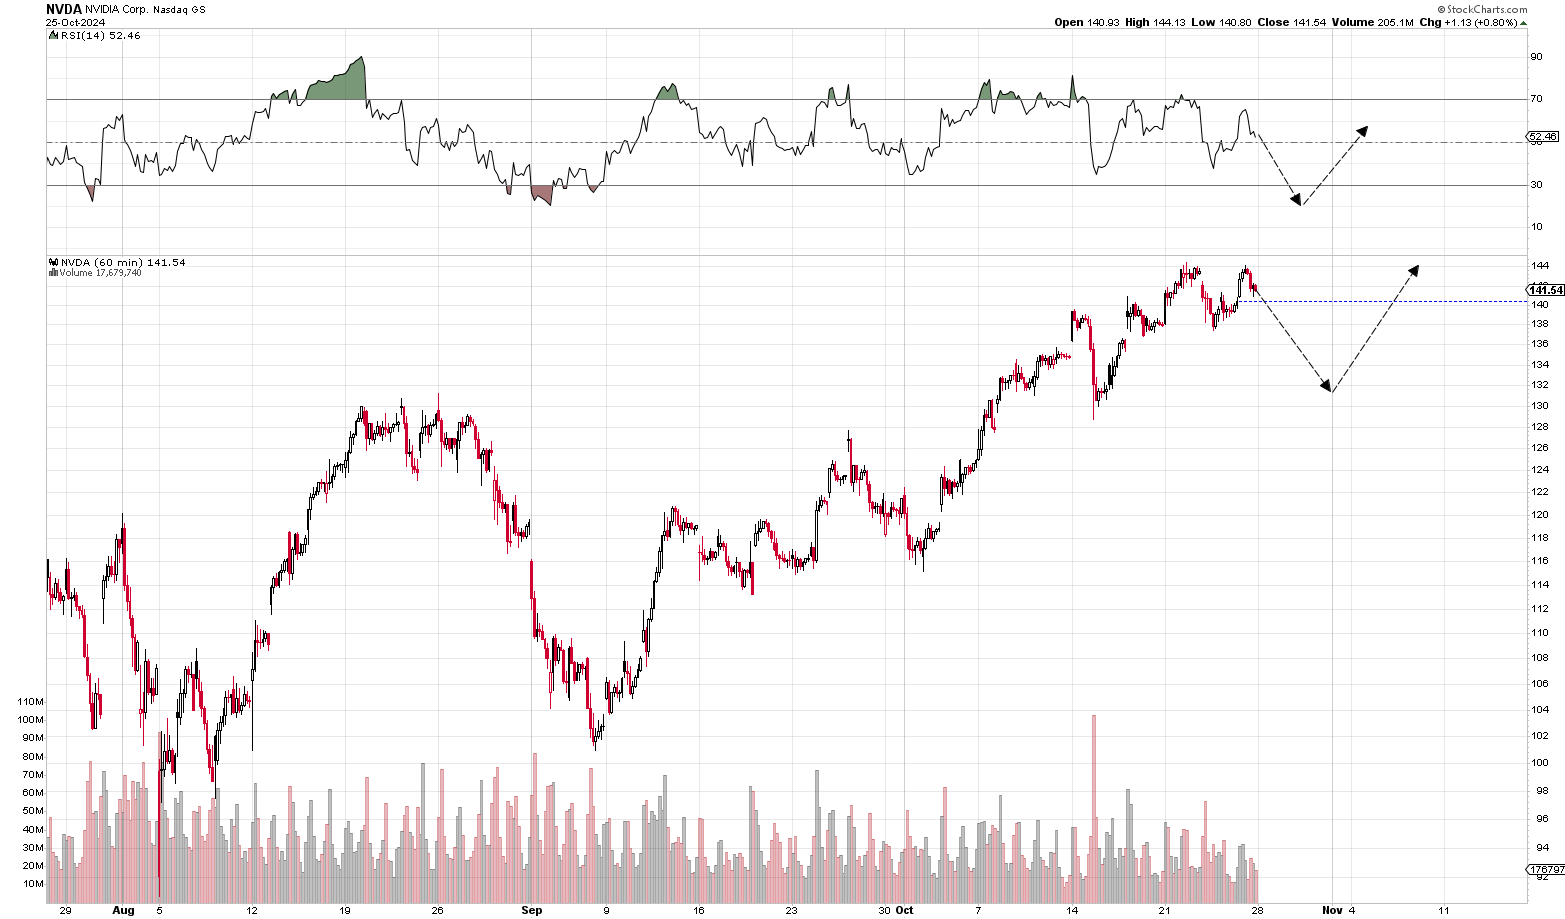
Scenario #3: Nvidia (NVDA) pushes down to oversold territory on the hourly, ahead of a big rally going into its earnings report
Here’s why I think Nvidia is in really good shape right. With only 18 trading days until it reports earnings, it unlikely to trade down too far from where it is currently trading. Unless something negative leaks, Nvidia is likely to gravitate to the upside as it heads into earnings.
But let’s suppose some selling comes up here at $140 given the opportunity to take profits. Maybe the NASDAQ-100 rolls over. Maybe we get negative earnings out of some of the big hitters. Even if that goes down, what is likely to happen from here is a huge rebound off of oversold territory on the hourly like we saw last week. Here’s a possible scenario as we head into Nvidia’s earnings:

Risk Factor #1: Anytime there’s a big consolidation, there’s risk for a breakdown and/or extended consolidation
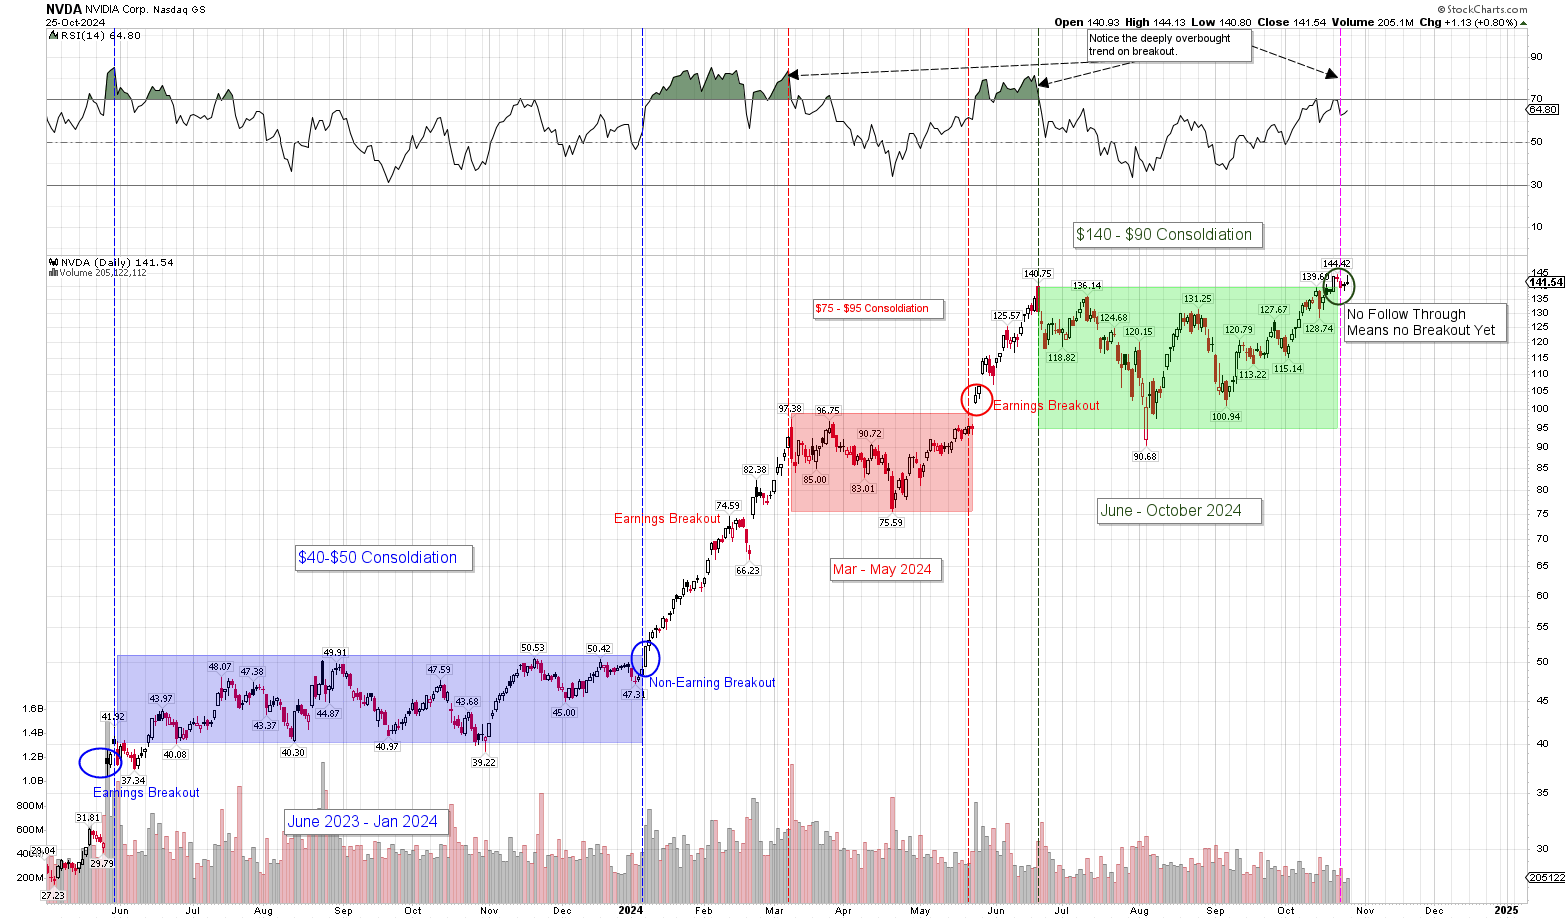
Back in June 2023, Nvidia visited the high $47-$50 zone before pulling back 15-20% a full SEVEN (7) times before it eventually broke out in January 2024. It sent nearly 6-months bouncing from a high of $50 to a low of $40. That’s a 20% move to the downside each time it went from $50 down to $40. Or $47 down to $39. The point here is this. Anytime any stock or market visits its consolidation high, there’s a fair degree of risk that things unfold to the downside. There’s no guarantee we get a breakout even on earnings. Nvidia could spend another 3 months screwing around with the $140 level and wait until January 2025 to break out again. In fact, if Nvidia followed the trend from last year, that’s exactly what would happen. It was the main reason why we originally set January as our target date by which we believed Nvidia would breakout to $150 at the latest. Nvidia has only spent only four months consolidating. Previous consolidations have lasted way longer.
Risk Factor #2: Breakout Consolidation Cycle
Similar to risk #1 above, the biggest risk factor to Nvidia’s intermediate-term outlook is the stock’s historical breakout-consolidation cycle. As we’ve pointed out several times now, there’s a clear-cut trend when it comes to Nvidia breakouts to new trading ranges. They all seem to occur on Nvidia’s Earnings Date. With earnings still 3.5 weeks out, this push to $140 may be a little premature and even if Nvidia ends up pushing through its $140 resistance, it may not get very far until it actually delivers on earnings.
Alternatively, if Nvidia does breakout here and pushes up to $160+ as it heads into its earnings results, earnings itself will turn into a high risk event where Nvidia could end up giving back much of the gains if it doesn’t deliver flawless earnings. So this earnings-breakout cycle does pose a timing-based risk factor to Nvidia’s intermediate-term direction. See below:

Counter-Point: The Risk Factors May be Overstated
One last thing worth noting. Nvidia spent 6-months consolidating between June 2023 and December 2023. It traded from a low of $39 to a high of $50.50 during the period. Interestingly, Nvidia (NVDA) broke out and went on a huge run from January 1 until it reported earnings in late February. In fact, it rallied a full 50% ($50 to $75) after breakout and before it reported earnings.
The stock pulled back a good 11% n the three days going into the report. But in the end, a big 50% run up into earnings did nothing to stop the stock from running an additional 47% up to $97 a share in March. The entire run went for 100% from January 1 to early March.
I bring this up because Nvidia has recently rallied 22.61% in the month of October. If it follows the trend in January 2024, it can easily rally into the November report, gap-up and add another big move after earnings. While in most cases, its earnings that determines breakout, it’s important o keep in mind that (1) we have a very small sample here of four-five previous cases and (2) we could easily see things unfold as they did in January.

Next year will be a tough year for Nvidia (NVDA), likely marked by periods of high volatility. Expect to see major swings both to the upside and downside as investors try to grapple with Nvidia’s sky high market cap, the law of large numbers and its explosive earnings growth. Every stock that reaches a high market like Apple, Microsoft, Google, Amazon and Nvidia goes through the same high volatility era of price discovery. I believe that will happen in 2025 for Nvidia.
Sam, I saw that you mentioned period of high volatility and wanted to get your perspective on how long these periods last for companies like NVDA? Thanks again for all the great information.
I’d say about a good year or two. You have to think about where Nvidia can go from here, the overall investment opportunity at $140-$150 a share and the size of its market-cap. When we start talking about $4-5T market caps, the company will have to bring down its trailing P/E ratio to 25-35 range by continuing to perform. Once that P/E drops down to the typical level for megacaps, then it can continue to press ahead in a more normalized environment.
At $4-5T+, the market isn’t going to give anything to Nvidia anymore. We’re not going to see high forward P/E ratios. Nvidia’s earnings will need to catch up and then it will need to continue to sustain at least 20-30% growth to move forward.
I like the new format, Sam.. well done!
Forecasting confidence is low for consolation periods and there’s just far more consistency in betting on the long side of the trade on oversold conditions than there is betting on consolidation periods. That’s the bottom line.
When we put on any trade, there are always two huge factors at play:
(1) How confident are we in the direction of the trade? If you see us buy, then we’re extremely confident in the direction of the trade. Our forecasting confidence is HIGH anytime we buy.
(2) How much risk is there in the trade if it goes wrong? This is extremely crucial. This is a publication where we have a lot of people potentially follow us. We CANNOT be wrong. Not even a slim chance of being wrong. We’re not going to put on trades unless we’re very confident in the outcome and unless we’ve completely hedged out the risk.
We’re not putting on any risks or taking any gambles at all.
With a SHORT strangle, the potential risk far exceeds our tolerance level even if we have high visibility — which in consolations, we don’t. A short strangle would never be low risk enough to meet our risk requirements. Long strangle maybe because of the inherent limitations. Iron Condor maybe as well because they’re inherently hedged.
But here’s the problem with any strategy involving naked shorts. And with a strangle, you’d have TWO naked short positions:
Suppose, we sold the January $110 puts at $2.87 and the January $160 calls at $7.20, we’d get $10.07 in premium right?
There’s a pretty good chance Nvidia does remains in that range for the next few months. The chances of Nvidia pushing north of $160 before January is probably slim.
But consider the unlimited risk potential if we’re wrong. Suppose Nvidia goes into earnings at $150, reports something truly extraordinary and gaps up to $180 a share. Now we’re a full 100% underwater right off the bat and have to already consider things like whether to stop loss out of the trade. Something I generally steer clear of even having to consider in any of our strategies.
If you look at our portfolios and strategy, we’re basically never going to be put in a position of having to even worry about putting in stop losses. Because all of our positions are initiated at massive discounts, at deeply oversold conditions and are all well hedged. We need not worry about any of that at all.
With a short strangle, you do. It’s simply too high risk for our publication. That’s an individual strategy that individual investors might want to consider. But nothing we can do here.
Also, with a high volatility stock like nviida, you do get the higher option premiums, but that comes with sky high risk of Nvidia doing what it did back in May when it rallied from $92 to $140 in 4-weeks time.
—–
An Iron Condor would be within our risk tolerance, but we would suffer from visibility issues. Setting aside the issue of RISK — which is hedged out with Iron Condor strategy — you still need to be able to forecast when consolation periods are likely to begin and end.
That is a lot more difficult to forecast than one might think. Where I think it could work as a strategy is in a situation where Nvidia has already had an extended run.
For example, if Nvidia runs to $160-$170 after it reports earnings and heading into January and if Nvidia trades deeply into overbought territory indicating that a correction is around the corner, an iron condor strategy might work to be able to capitalize on the immediate downside.
IF we felt confident that Nvidia might correct to a very particular price-point and no lower, then that’s where an iron condor might make sense.
But even then you’re threading a very tiny needle for not much of a gain. Consider why. With an iron condor, you really need time on your side if your main strategy is to put on a long spread trade during corrections. That’s our main strategy.
So let’s consider a situation where Nvidia sustains a major correction from $170 down to $120. In that situation, I’d feel fairly confident we can put on a 100% yielding spread trade with a fairly high confidence level. But that only works if we’re sitting in cash to begin with.
If we’re in an iron condor trade waiting for expiration to happen so we can collect on the theta decade, that can’t work if there’ s month left to expiration and we’re sitting in iron condor where the long side of the trade has gone to practically $0 while the short side of the trade is at sky high levels due to the correction.
While ultimately we might believe that Nvidia doesn’t go lower than $120 and likely bounces, we can’t capitalize on that because there might be a month left until expiration. We’d have to sell the position and purchase our vertical call-spread.
It’s the same problem with buying put-spreads to hedge or selling naked calls when what you want to do is go long leaps.
That’s why as our $5k to $1M strategy is concerned, we’re going to be in straight long calls during in-between periods. Because those have no defined time-limit. Suppose we ended up buying Tesla last week ahead of earnings. WE could have already sold that position today. We don’t need to wait for a prolonged period of consolidation to happen to profit. We can be in and out.
What going to happen now that META and Microsoft failed to go higher on earnings? Does that mean the top is in for the QQQ?